. 2021 Sep 15;12(43):14396–14413. doi: 10.1039/d1sc03564a

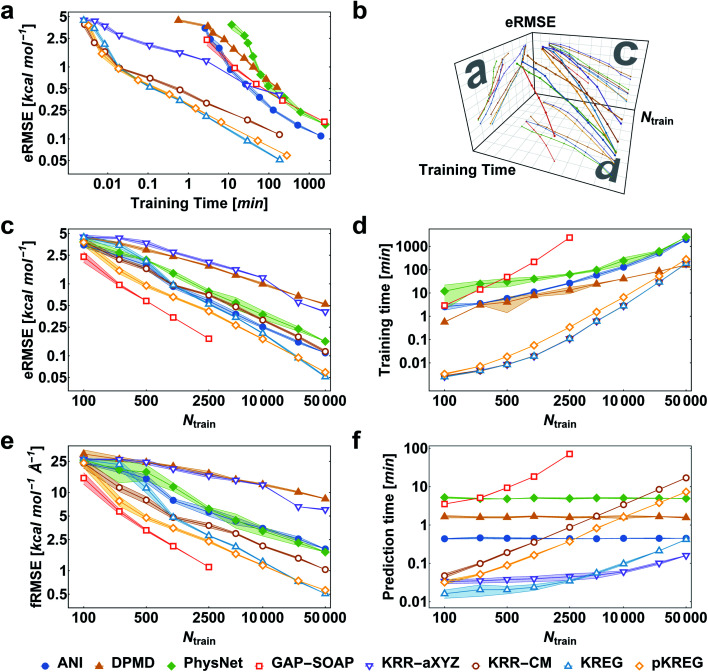
Fig. 2. Performance curves of the different machine learning potentials trained only on energies for the MD17-ethanol dataset. (a) Root-mean-squared error in energies (eRMSE) vs. training time. (b) Plot of models' performance in the 3D space of the number of training points (Ntrain), training time, and eRMSE. (c) eRMSE vs. the number of training points. (d) Training time vs. the number of training points. (e) RMSE in forces (fRMSE) vs. the number of training points. (f) Time for predicting energies and forces for 20k points in the test set vs. the number of training points. All computations were performed on two processors with 36 Intel Xeon(R) Gold 6240 CPUs (2.60 GHz). The shaded areas in the plots correspond to one standard deviation. Filled markers are used for neural network potentials, while empty markers for kernel method potentials.

Fig. 2