. 2021 Sep 15;12(43):14396–14413. doi: 10.1039/d1sc03564a

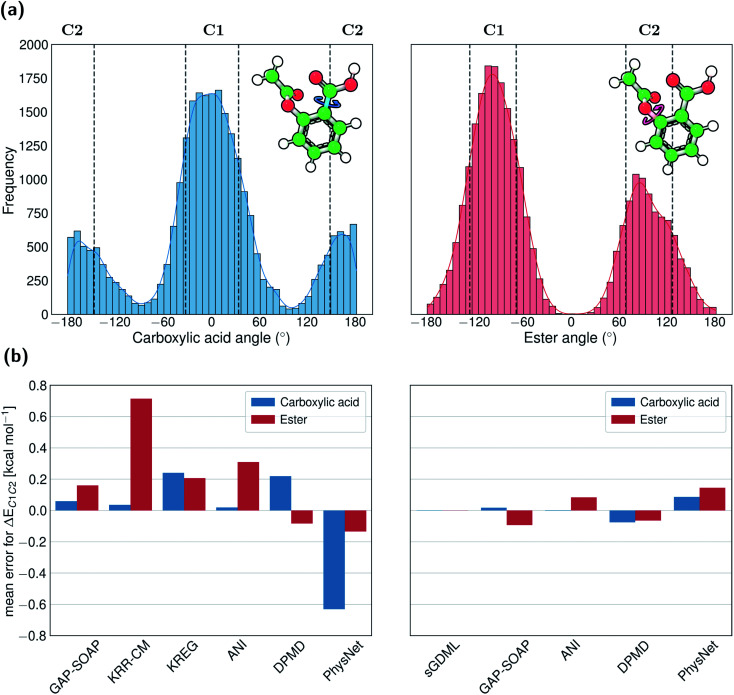
Fig. 9. Performance of MLPs for conformational energies of aspirin. (a) Histogram of the dihedral angles distribution describing the most frequent conformations found in the full MD17-aspirin data set with respect to the rotation of the carboxylic acid (left panel) and ester (right panel) groups. Vertical lines are drawn to indicate the threshold of dihedral angles (mean ± standard deviation) used to select clusters of conformers around the local minima. (b) Errors of MLPs trained with 1000 points on energies (left panel) and using energies and forces (right panel) in predicting the difference between the mean energy of conformer clusters C1 and C2 (data at https://figshare.com/s/6cf4347e2682829bff75). For the carboxylic group, the difference between the mean energy of conformers C2 and C1 is 0.87 kcal mol−1, while this difference is only 0.02 kcal mol−1 for the ester group.

Fig. 9