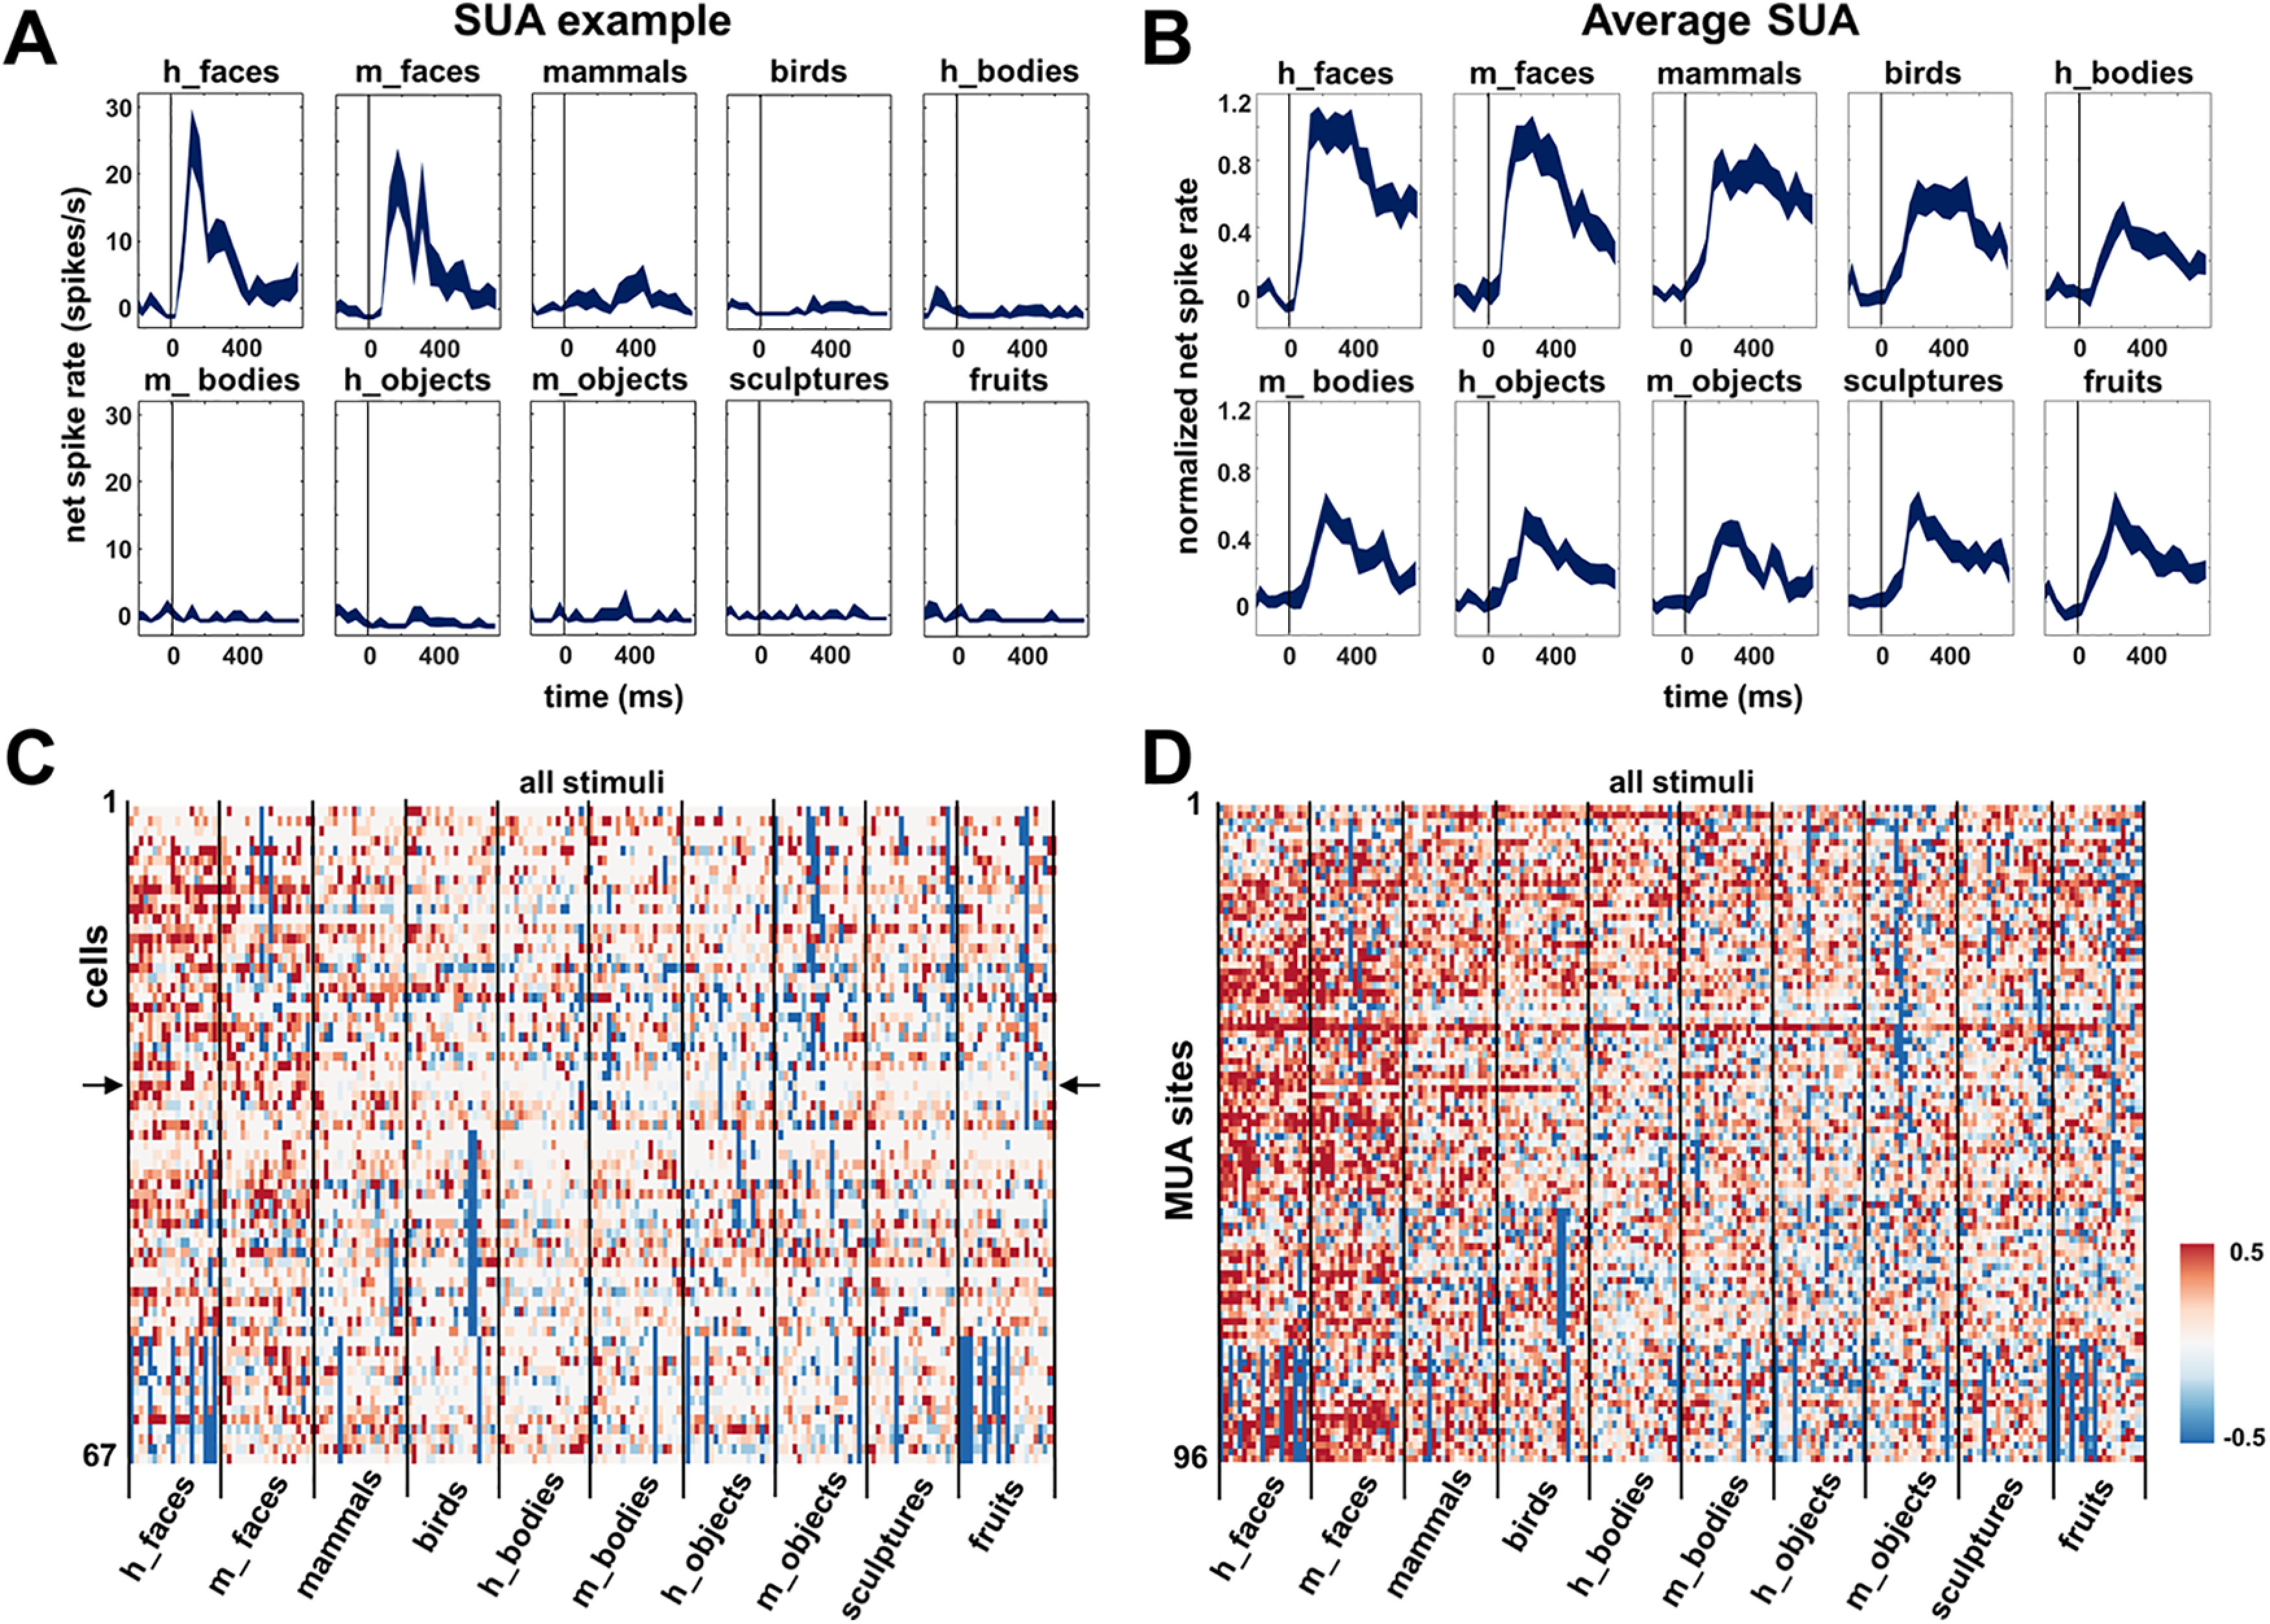
Figure 3.

Category selectivity. A, Example SUA, selective responses to faces (both human and monkey) with almost no response to the other categories. B, Average SUA over all visually responsive units (N = 67). C, Net normalized response illustrating between- and within-category selectivity of all visually responsive SUAs (N = 67); the example SUA is depicted with arrows. D, Net normalized responses of all visually responsive MUA sites (N = 96).
