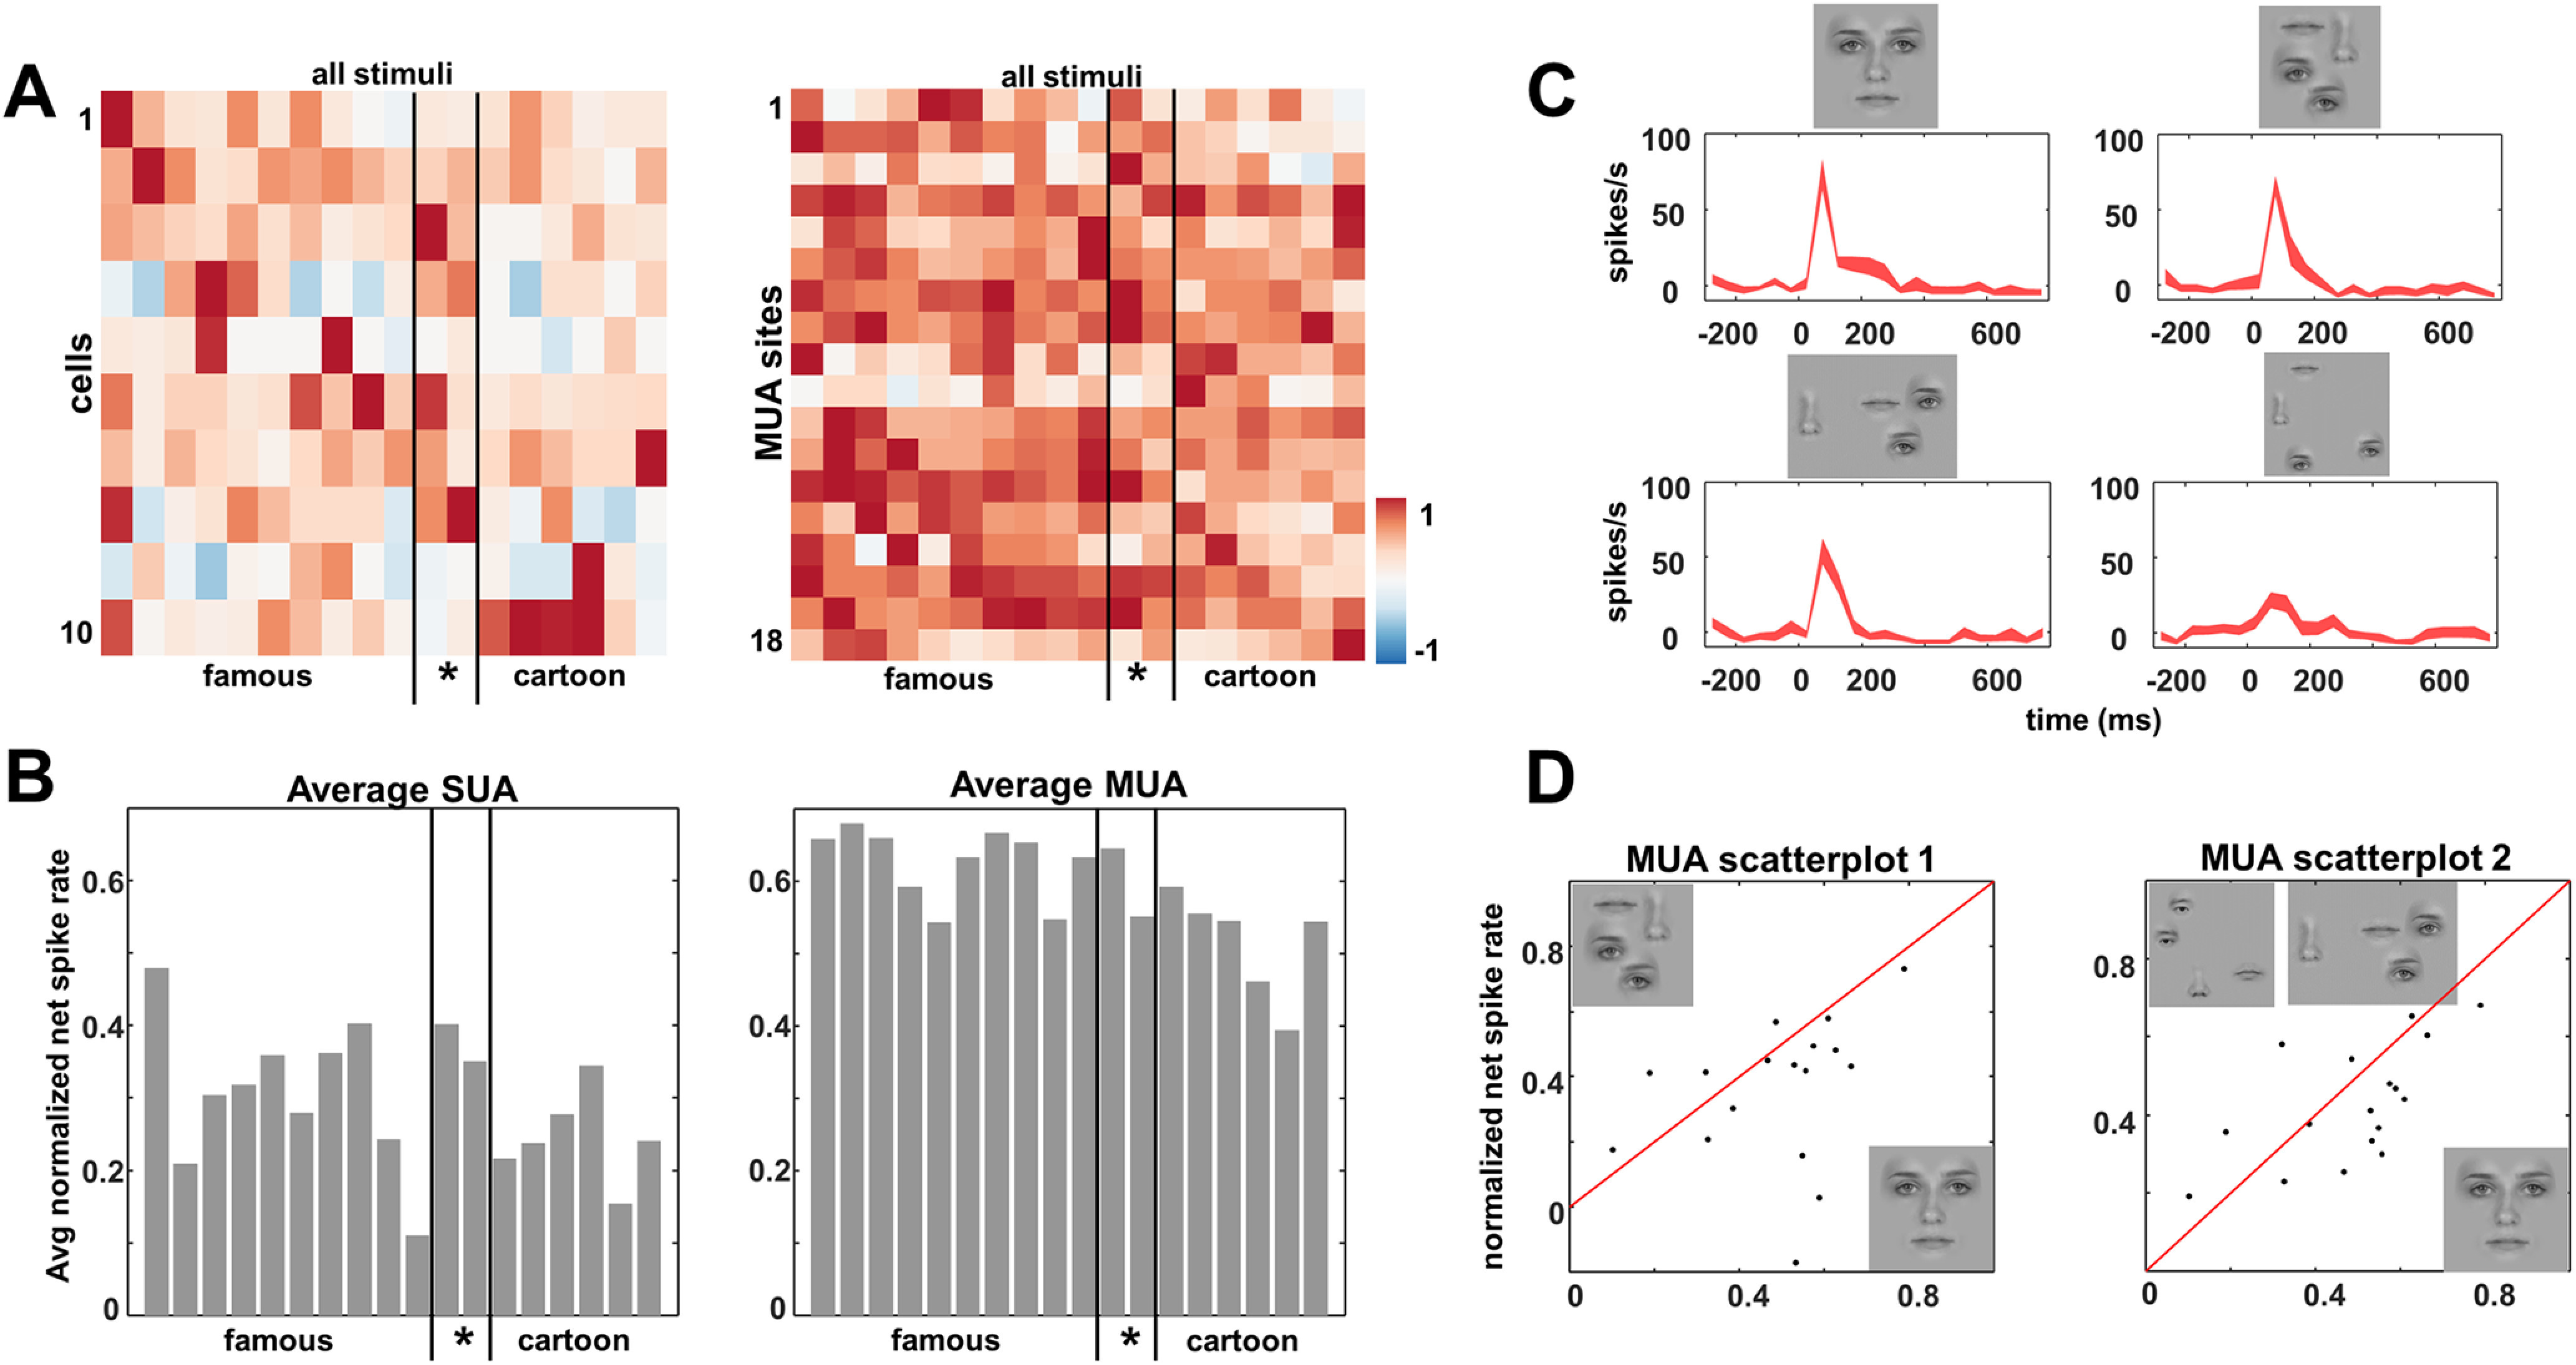
Figure 5.

Within-category face selectivity and effect of feature scrambling. A, Normalized SUA (left) and MUA (right) response for each site and stimulus. B, Average normalized net response for all sites per stimulus. C, Example SUA response to feature scrambling; example stimuli are shown in D. D, MUA scatter plot for intact versus feature scrambled faces at same location (left) and for intact versus feature scrambled faces with the face elements farther apart (right).
