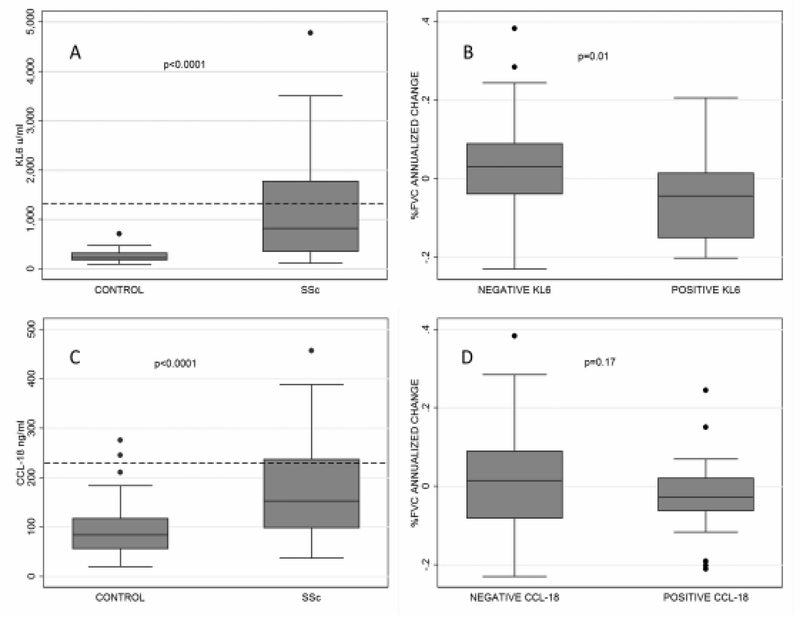
Figure 1.
A. KL-6 levels (U/ml) in patients with SSc versus controls (dashed line = 1273 cutoff). B. FVC% annualized percent change in KL-6-positive versus -negative patients based on a cutoff of 1273 U/ml. C. CCL-18 levels (ng/ml) in patients with SSc versus controls. D. FVC% annualized percent change in CCL-18-positive versus -negative patients based on a cutoff of 140 ng/ml. Lower values in FVC% percent change correspond to a faster FVC decline. SSc: systemic sclerosis; FVC%: % forced vital capacity.

