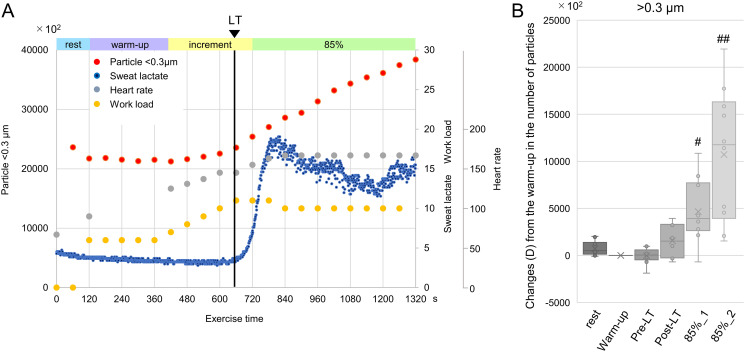
Fig 3. Airborne particulates generation during exercise.
(A) Representative graphs of the concentration of airborne particulates (<0.3 μm; red dots), sweat lactate (blue dots) levels, and heart rate (gray dots) during exercise. (B) Changes (Δ) from the warm-up in the number of airborne particulates (>0.3 μm; n = 10). #p<0.01, ##p<0.001 compared with the warm-up. LT, lactate threshold; 85%_1, the first half of the constant-load exercise at 85% of the expected maximum heart rate; 85%_2, the latter half of the constant-load exercise at 85% of the expected maximum heart rate.

