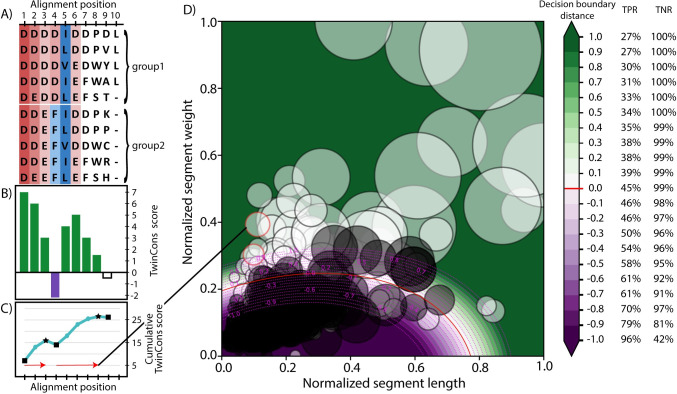
Fig 1. TwinCons results from composite alignments.
(A) Example composite sequence alignment. Conserved positions within each group are shaded blue for hydrophobic residues and red for charged residues; variable positions are not shaded. Consistent color spanning two groups represents conservation. Change of colors between but not within groups represents signature. (B) TwinCons score for each position in the example composite alignment. Conservation spanning groups produces large positive TwinCons scores (green, positions 1–3, 5). Conservation within but not between groups produces negative scores (purple, position 4). Variability within and between groups produces scores near 0 (white, position 9). Columns with high proportion of gaps produce score equal to 0 (position 10). (C) Cumulative TwinCons score calculated from positional scores. Local minima are indicated with black squares and local maxima are indicated with black stars. Segments are defined as the alignment positions between adjacent local minima (squares) and maxima (stars). Resulting segments are indicated with red arrows. (D) TwinCons results for segments from the BaliBASE multiple alignments. Segments from alignments with related sequence groups are shown with white circles and segments from alignments with unrelated sequence groups are shown with black circles. Each alignment produces multiple segments with normalized length and weight plotted on the 2D graph. One alignment can produce multiple segments (white circles with red boundaries). Segment length and weight is normalized by the maximal length and weight present in the dataset. Circle sizes indicate absolute segment lengths. The decision boundary calculated between segments from related sequence groups (white circles) and segments from unrelated sequence groups (black circles) is shown with red line. Distance away from the decision boundary in the range of -1 to +1 is shown with a diverging gradient and magenta dotted line. Cross validation statistics of true positive rate (TPR) and true negative rate (TNR) for detecting correct assignments of the alignments for each decision boundary distance are on the right.

