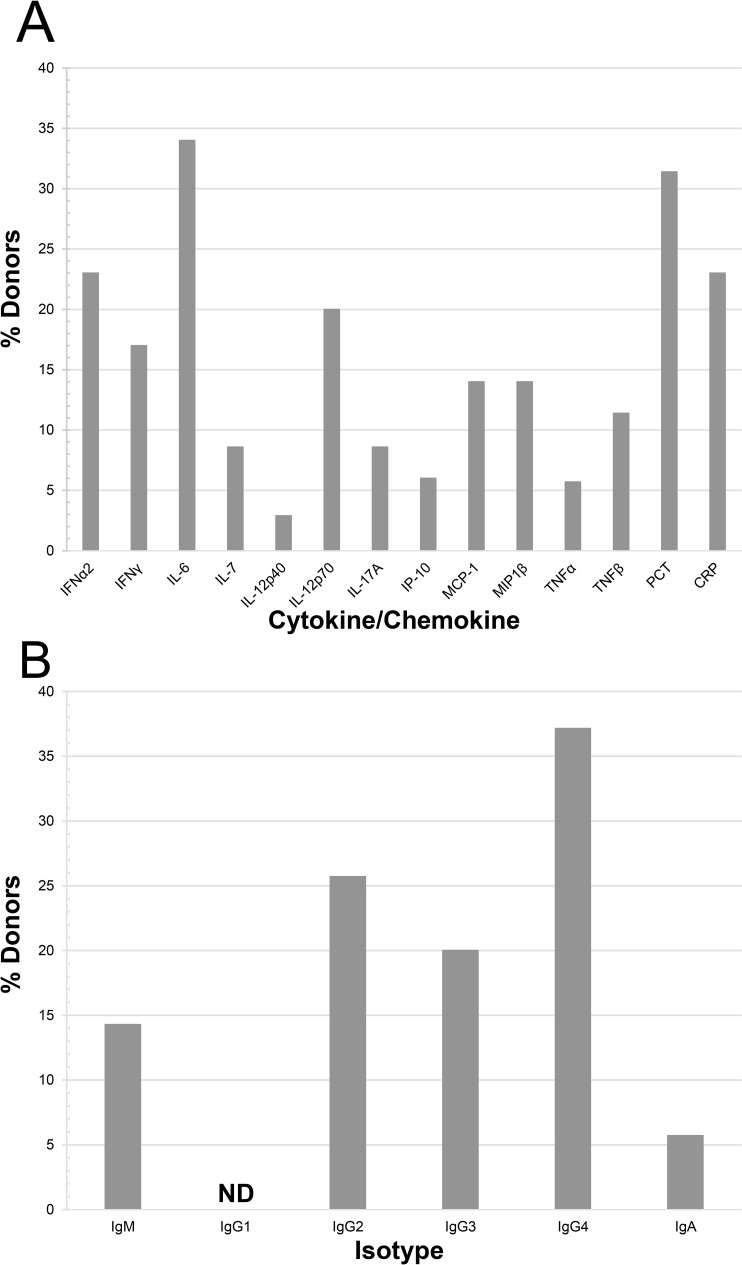
Fig 1. Composition of donor plasma samples.
Donor plasma samples (n = 35) were analyzed for concentration of inflammatory cytokines/chemokines and Ig isotypes using multiplex immunoassays via the Luminex platform and analyzed using Belysa software. Alternatively, ELISA analysis was performed for measurement of PCT concentration. Samples were compared to healthy control plasma and were marked as elevated if the concentration was greater than the mean of the control samples plus two times the standard deviation (n = 12–16). (A) The percentage of donor samples with elevated values was calculated for each analyte, 14 of which exhibited any level of elevation. (B) The percentage of donors with elevation in the concentration of Ig Isotypes. ND, none detected.

