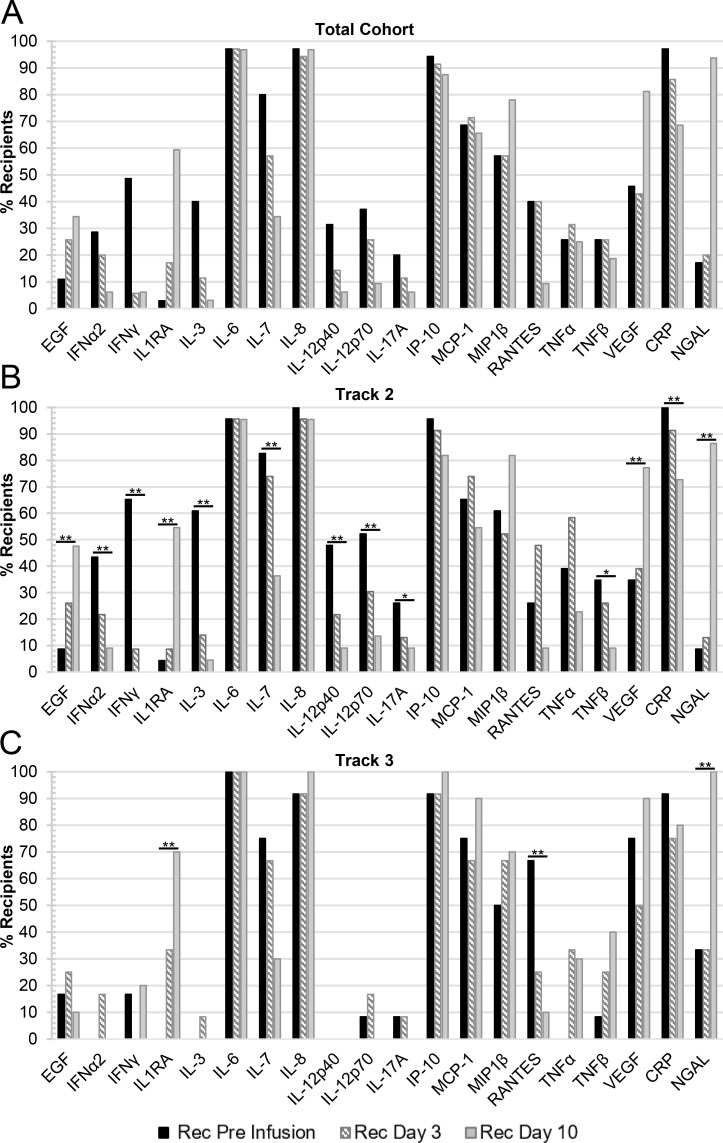
Fig 2. The percentage of CPT recipients with elevated cytokine/chemokine concentrations in their plasma over all time points.
CPT recipient plasma samples were compared to healthy control plasma and were marked as elevated if the concentration was greater than the mean of the control samples plus two times the standard deviation (n = 12–16). Included in these summary figures are the 20 cytokines/chemokines that were elevated in at least 20% of the recipients at any of the time points examined and grouped based on either: (A) the total cohort of recipients (Pre-infusion, Day 3, n = 35; or Day 10, n = 32); (B) recipients in Track 2 (Pre-infusion, Day 3, n = 23; or Day 10, n = 22); or (C) recipients in Track 3 (Pre-infusion, Day 3, n = 12; or Day 10, n = 10). Statistically significant changes in mean values between time points in the Track 2 and Track 3 cohorts are denoted by a bar and single asterisk (*) for 0.01≤p≤0.05 or a double asterisk (**) for p<0.01.

