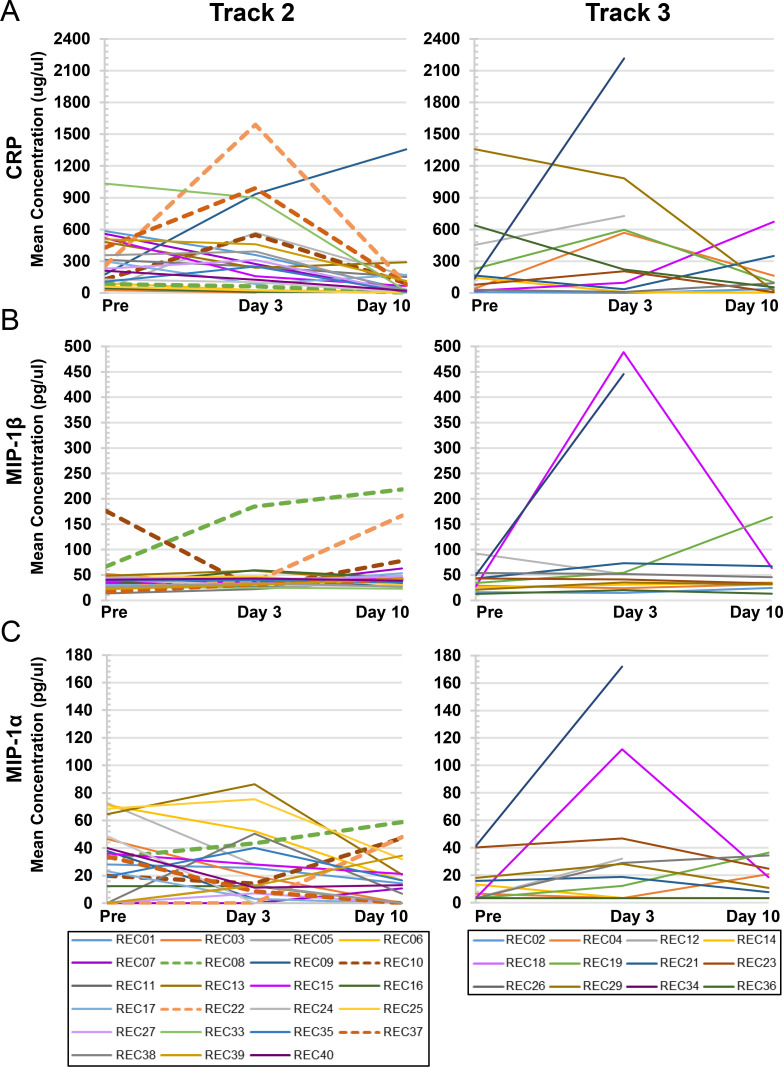
Fig 5. Individual concentration plots of cytokines/chemokines correlating with progression to intubation in Track 2 recipients.
Statistical analyses, as detailed in Table 7, indicated that three analytes significantly correlated with the progression of COVID-19 respiratory disease in Track 2 recipients to the point of necessitating mechanical intubation (REC08, REC10, REC22, and REC37, indicated by dashed lines). Individual concentration plots are shown for recipients in Track 2 (left-hand panels; Pre-infusion, Day 3, n = 23; or Day 10, n = 22) and Track 3 (right-hand panels; Pre-infusion, Day 3, n = 12; or Day 10, n = 10), respectively for: (A) CRP; (B) MIP-1β; and (C) MIP-1α. The change in the mean concentration of CRP from Pre-Infusion to Day 3 correlated with progression to intubation (p = 0.028); for MIP-1β from Pre-Infusion to Day 3 (p = 0.049); and for MIP-1α from Day 3 to Day 10 (p = 0.037).

