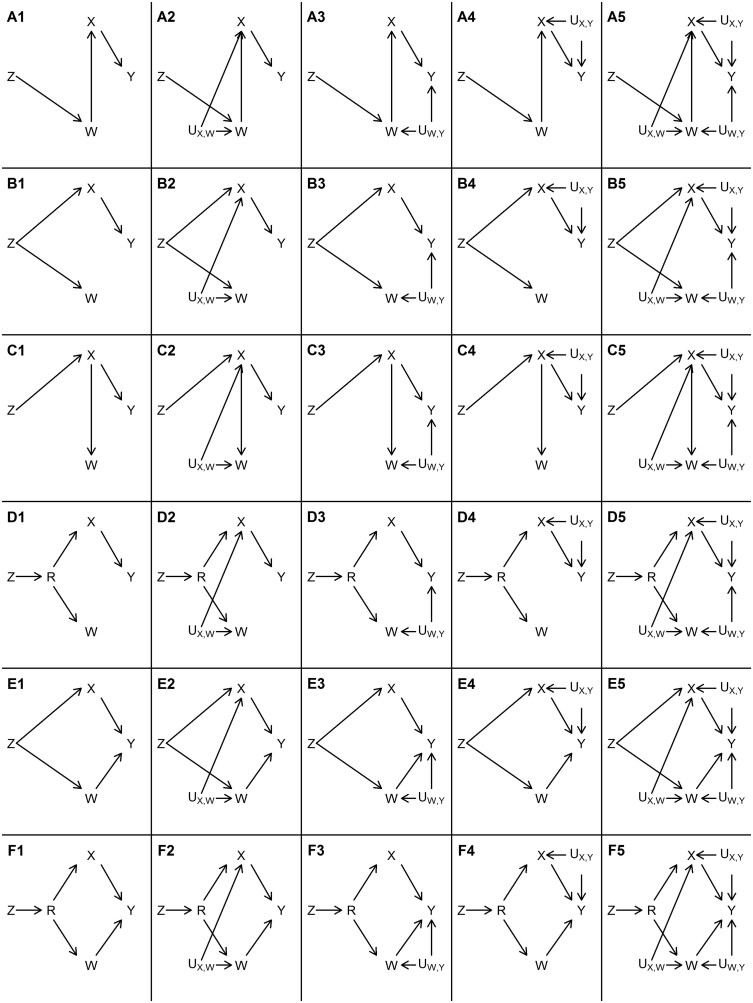
Figure 2.
Causal structures that were assessed in the simulation study.: genetic instrument; : covariable; : possible direct consequence of ; : exposure; : outcome: : unmeasured common cause. Rows represent different causal structures between , , and as illustrated by Scenarios A ( fully mediates the effect of on ), B ( independently affects both and ), C ( fully mediates the effect of on ), D (effect of on and is mediated by a common cause ), E (same as B except that has a direct effect on ) and F (same as D except that has a direct effect on ). Columns represent different confounding structures between , and as illustrated by Scenarios A1-F1 (no unmeasured confounders other than R), A2-F2 (presence of - confounder: ), A3-F3 (presence of - confounder: ), A4-F4 (presence of - confounder ) and A5-F5 (presence of all three confounders simultaneously)

