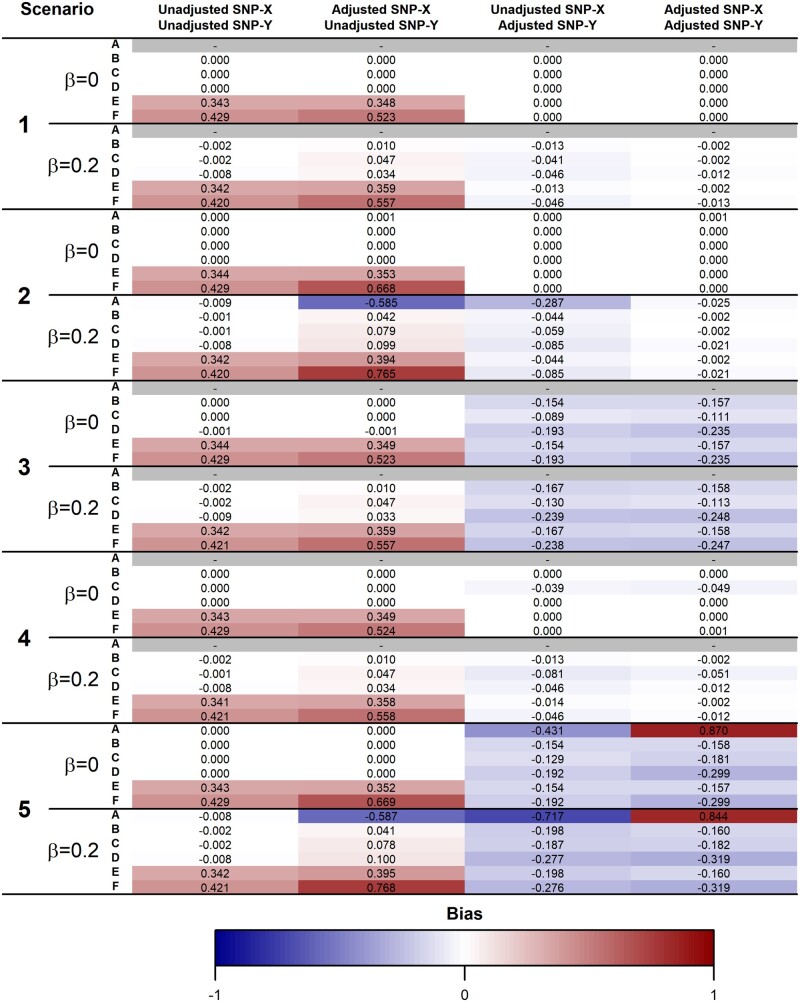
Figure 4.
Mean bias across 5000 simulations of the causal effect estimate using homogeneous genetic instruments. true causal effect of the exposure () on the outcome (). Scenarios A-F assume different causal relationships among , , the instrument (), the covariate () and a common cause of and affected by (). In Scenarios A1-F1, there are no unmeasured confounders. In Scenarios A2-F2, there is an unmeasured common cause of and . In Scenarios A3-F3, there is an unmeasured common cause of and . In Scenarios A4-F4, there is an unmeasured common cause of and . In Scenarios A5-F5, all these three unmeasured confounders are present. The scenarios are illustrated in Figure 2 and described in detail in the ‘Simulation study’ section. Scenarios where no genetic variants are selected as instruments (because adjustment for results in no open path between and ) are marked in grey

