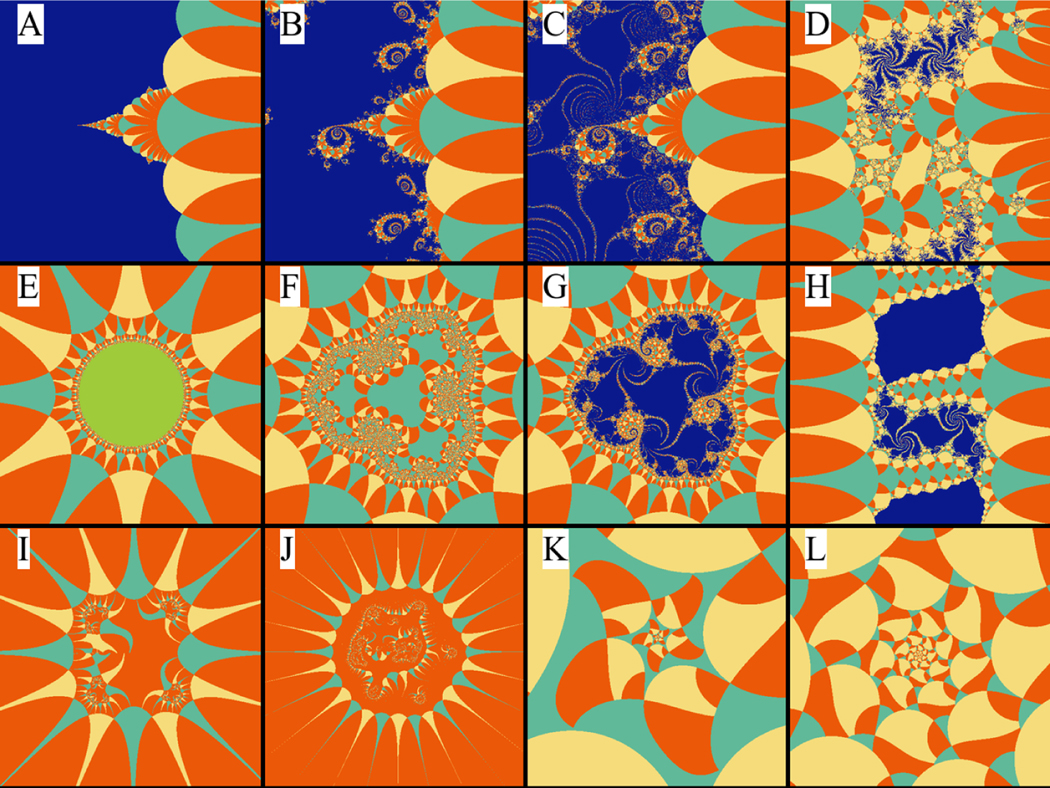
Figure 5:

Various visualizations of the biomorph set using different parameters. In panel A, α = β = γ = ϵ = x0 = y0 = 0 and δ = n = 1.0. In panel B, we change x0 = 9.72 × 10⁻³ and y0 = 1–18 × 10−3. In panel C, minor changes to x0 = 1.10 × 10⁻² and y0 = 1.14 × 10⁻³ produce the fine details that are observed. Panel D is obtained by setting α = 1., x0 = 0.669, and y0 = 0.2297. Panel E is obtained by setting α = γ = ϵ = x0 = y0 = 0, β = 1 and n = 3, which transforms into panel F by increasing x0 into 0.4, and then into panel G when y0 is increased to 3.4 × 10⁻³. Panel H is obtained by setting α = β = γ = 0, α = n =1, x0 = 0.5 and y0 = 0.077. Panel I is obtained by setting α = γ = ϵ = 0, β = δ = 1, n = 4, x0 = 1.5 and y0 = 0.3. Panel J is obtained by setting α = ϵ = 0, β = δ = 1, γ = −2, x0 = 1.5548 and y0 = 0.366. Panel K is obtained by setting α = β = ϵ = ϵ = x0 = y0 = 0, and γ = n = 1, which transforms into panel L is by setting x0 = −.535 and y0 = 0.043.
