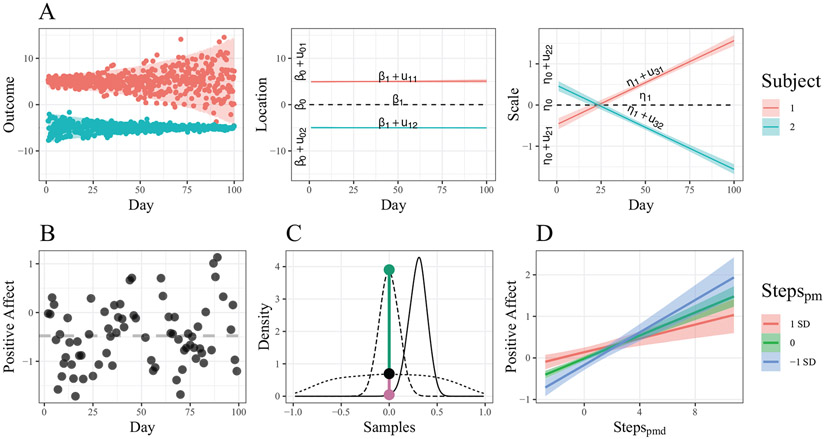
Figure 1.
(A) An example dataset consisting of raw observations for two individuals (Panel 1), with predicted locations (Panel 2) and log variances (Panel 3) from the MELSM. (B) A scatter plot of PA and Day for one subject. The gray line is the person’s mean. (C) Illustration of Savage-Dickey Bayes Factors for correlations when H0 is supported (Green) and when H1 is supported (Pink). The dotted line is the implied prior for correlations using the matrix-F distribution. The dashed line is a posterior distribution that favors the null hypothesis (BF01 ≈ 5.69), whereas the solid line is a posterior distribution that supports the alternative hypothesis (BF10 ≈ 15.40). (D) The interaction between mean number of steps and the deviation from the mean on PA. The effect of daily activity on PA is greater for those with less average activity.

