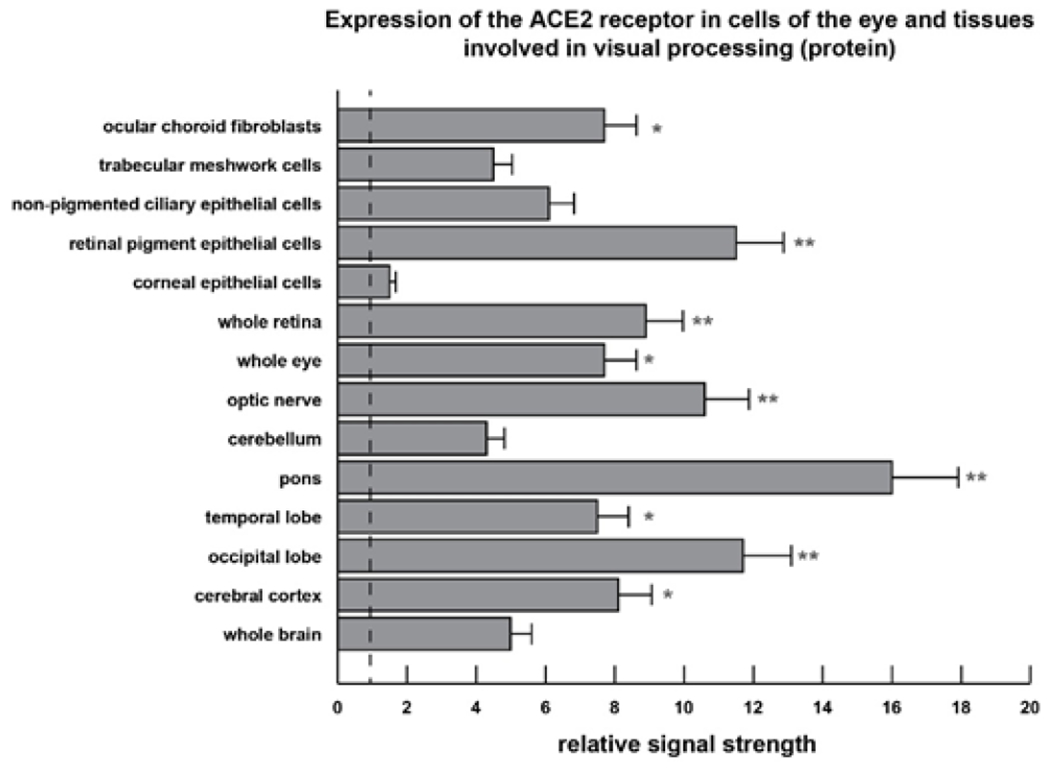
Figure 2:

Cell- and tissue-specific patterns of ACE2 expression at the protein level in selected human ocular cells and in anatomical areas of the brain involved in visual processing; bar graph of ELISA analysis (see Supplementary File 1); we observed a very strong correlation between ACE2 mRNA abundance (Figure 1) with ACE2 protein abundance (Figure 2); the highest expression of the SARS-CoV-2 receptor ACE-2 protein was found in RPE cells, the whole retina, optic nerve, the pons and the occipital lobe that contains the primary visual cortex and main visual processing area (Brodmann Area17); relative signal strength refers to control β-actin protein levels in the same tissues; see text for further details; a vertical dashed line at 1.0 is included for ease of comparison; a minimum of N=3 ELISA analyses were performed for each protein determination in cells or tissues; *p<0.05; **p<0.01 (ANOVA); error bars represent one standard deviation of the mean.
