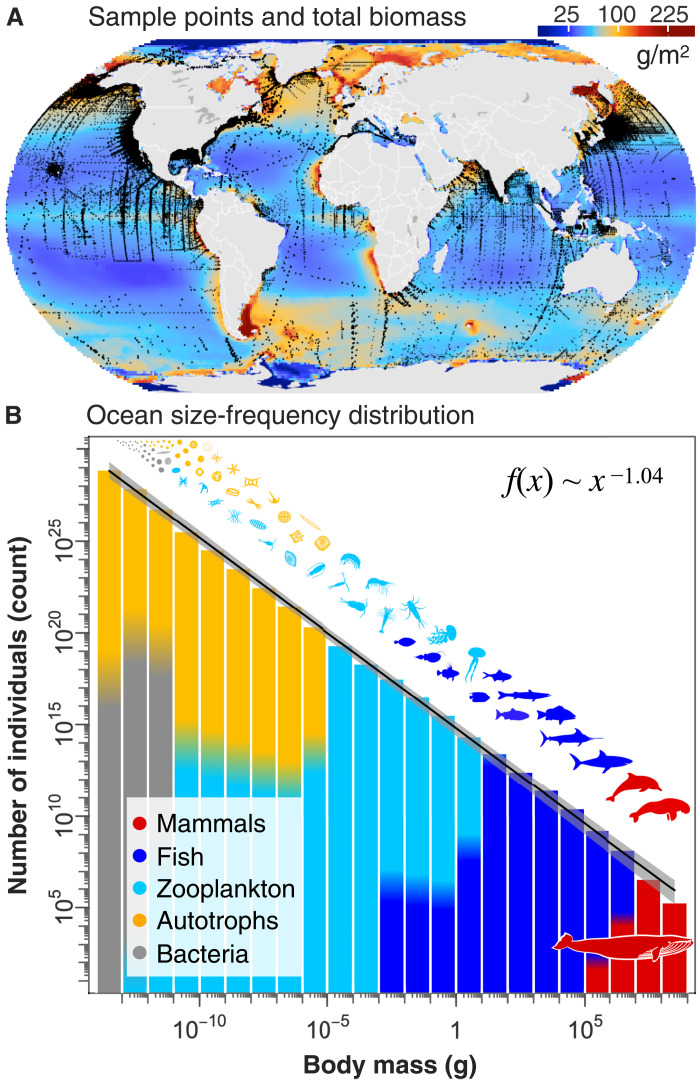
Fig. 1. The global ocean size spectrum.
(A) The black mapped points are n = 226,405 sample locations for measurements of heterotrophic bacteria and zooplankton. Autotrophs were estimated from satellite imagery of surface chlorophyll and fish from global process models constrained by catch data. Marine mammals are estimated from species global population estimates, and their biomass is not included on the map. Biomass (g/m2; wet weight) of each group is summed over all groups in each 1° region of the ocean (only biomass in the upper 200 m is shown here). (B) Total ocean biomass (wet weight) is partitioned across relevant size classes (g, wet weight) for each group to estimate the global size spectrum. This is shown as the total number of individuals in each order of magnitude size class over the ocean’s epipelagic and continental shelves (upper ~200 m), giving an exponent of −1.04 (95% CI: −1.05 to −1.02). The gray confidence band includes biomass uncertainty in each size class (Fig. 2 A) and uncertainty in the size distribution of each group (Fig. 2C, i). Bin colors show the relative fraction of each group on a linear axis [no relation to y axis or to the biomass in (A)]. Further details are in Materials and Methods.

