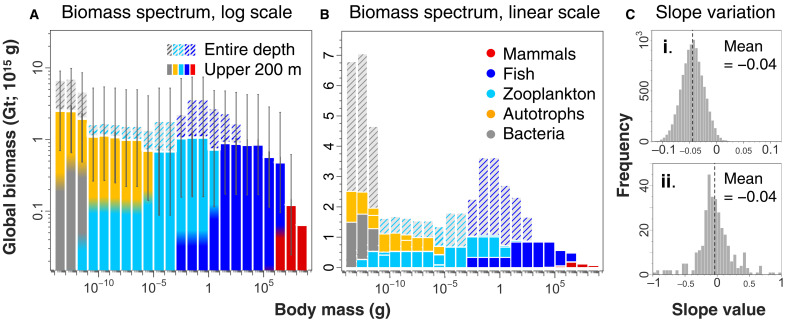
Fig. 2. The pristine ocean biomass spectrum.
Total estimated historic ocean biomass in each order of magnitude size class is approximately 1 Gt (gigatonnes or petagrams = 1015 g), with exceptions at either extreme. Biomass is shown in the upper 200 m of the ocean (colored) and extending to the seafloor (hatched colors represent the group that dominates below the epipelagic; bacteria dominate <10−11 g, and mesopelagic fish dominate size classes 10−3 to 103 g). (A) Global ocean biomass is shown on a logarithmic scale with logarithmic 95% CIs on epipelagic biomass. Bin colors show the relative fraction of each group (no relation to y axis). (B) Biomass estimates in (A) are shown on a linear scale to highlight differences of bacteria and whales from the overall trend. (C) Frequency histograms of biomass spectrum slopes for (i) resampled data incorporating uncertainty in both biomass [shown in (A)] and the size distribution of each group (n = 10,000 simulations) and (ii) prior published slope values for n = 325 measured biomass spectra (from 47 separate studies; note the difference in x axis from C, i).

