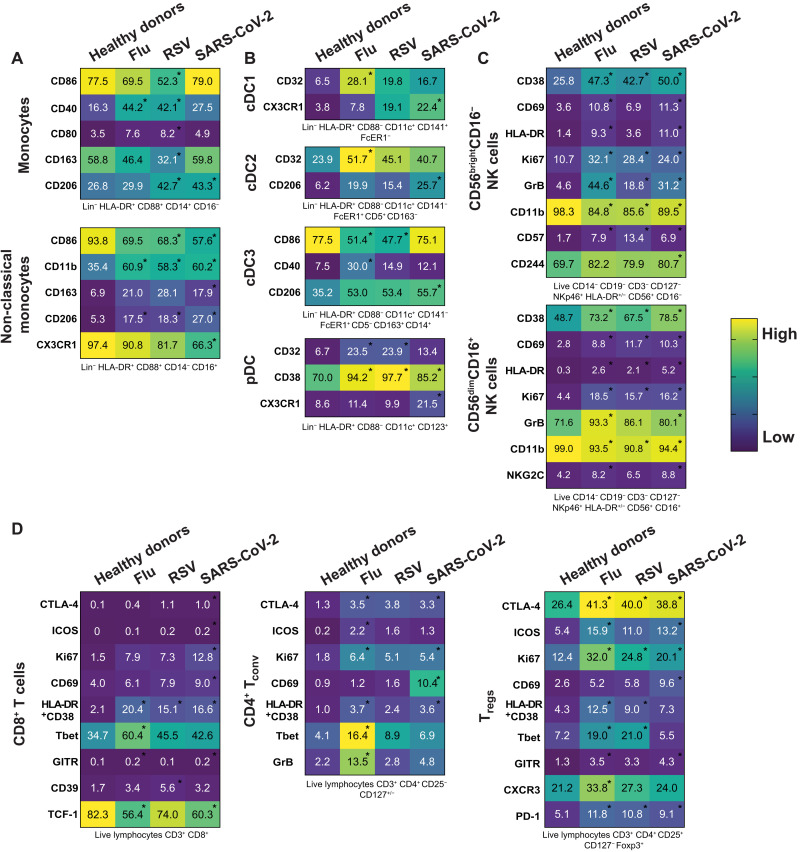
Fig. 3. Immune cell phenotypic changes are consistent with a respiratory virus signature.
(A to D) Heatmaps representing the expression pattern for all the indicated molecules within the main subsets of (A) the monocyte family, (B) the DC family, (C) the NK cell family, and (D) the T cell family for each group of the cohort. Gating strategy of the different subsets can be found under each heatmap (also see fig. S1), and numbers inside boxes represent the mean of frequency for each marker among the specific subsets. Depending on the distribution of our data, statistical analyses were performed using either one-way ANOVA or Kruskal-Wallis test with Tukey’s or Dunn’s multiple comparisons test, respectively. Asterisk inside the boxes is indicative of a significant difference compared to the healthy donors’ group and can include a P value from 0.05 to 0.0001.

