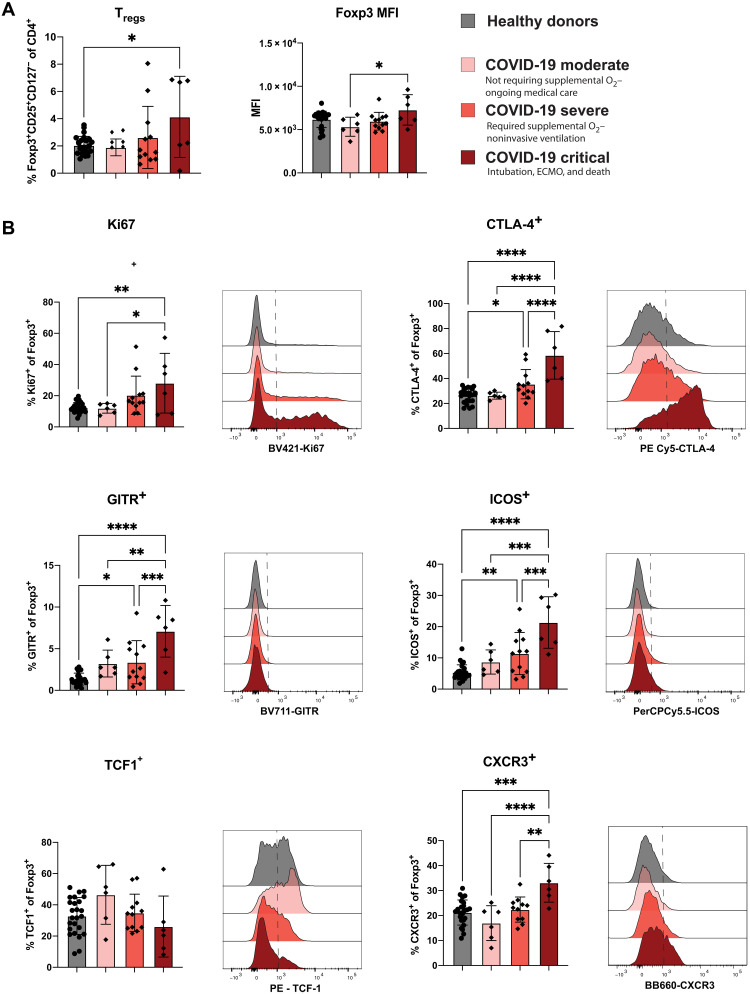
Fig. 6. Tregs in patients with critical COVID-19 disease are increased in frequency and display a heightened activation signature.
(A) Bar graphs showing (left) the frequency of Treg and (right) the MFI of Foxp3 among parent for healthy donors and severity-based groups of COVID-19. (B) Representative histograms and quantification of the expression of activation and suppressive markers within Tregs for healthy donors as well as moderate COVID-19 (n = 6), severe COVID-19 (n = 12), and critical COVID-19 (n = 6). All data and are represented as means ± SD. Depending on the distribution of our data, statistical analyses were performed using either one-way ANOVA or Kruskal-Wallis test with Tukey’s or Dunn’s multiple comparisons test, respectively. *P < 0.05; **P < 0.01; ***P < 0.001; ****P < 0.0001.

