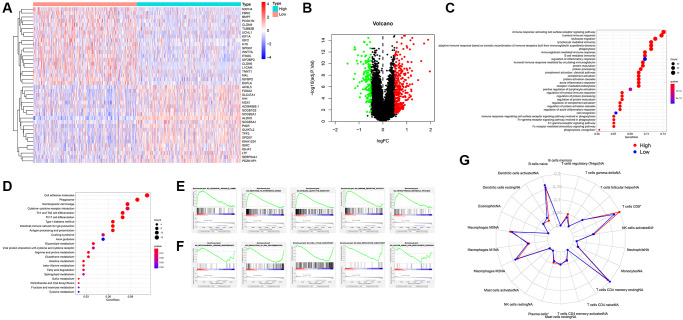
Figure 3.
Analysis of GO, KEGG, GSEA function enrichment. (A) Heatmap showing differential gene expression (FDR < 0.05) between low expression group and high expression group of ALDH2. (B) Volcano plot of all differential gene expression analysis. (C) GO enrichment analysis. (D) KEGG enrichment analysis. (E) GSEA enrichment analysis of high expression group of ALDH2. (F) GSEA enrichment analysis of low expression group of ALDH2. (G) Enrichment scores for 22 immune cell subpopulations based on deconvolution by CIBERSORT between low expression group and high expression group of ALDH2. *P < 0.05, ***P < 0.001.

