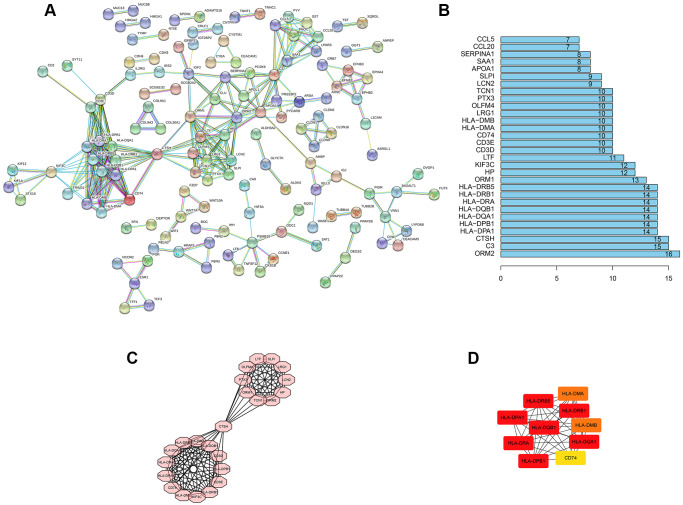
Figure 4.
PPI network construction. (A) PPI network of al DEGs. The individual nodes were hidden. The interaction relationship prediction threshold is > 0.900. (B) Top 30 genes with the highest number of nodes. (C) The core subnet of the PPI network by using the MCODE app. (D) The core gene of the PPI network by using the cytoHubba app.

