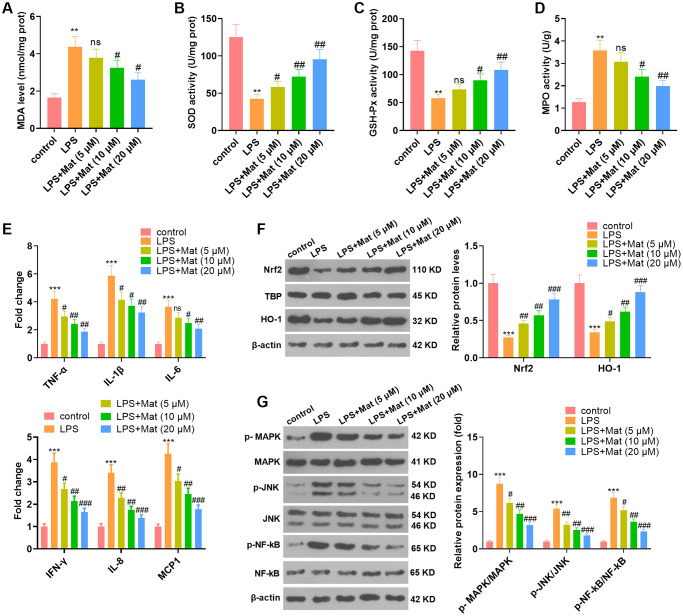
Figure 2.
Mat mitigated LPS-mediated oxidative stress and inflammation in microglia. After 1 μg/mL LPS treatment for 24 hours, NSC-34 and HT22 cells were treated with varying concentrations (5 to 20 μg/mL) of Mat for 48 hours. (A–D) MDA production and SOD, CAT and GSH-Px activities were measured by utilizing the BCA protein assay kits. (E) ELISA was implemented to test the cellular levels of TNF-α, IL-1β, IL-6, IFN-γ, IL-8 and MCP1. (F–G) The profiles of Nrf2, HO-1, MAPK P38, JNK and NF-κB were compared by WB. **P < 0.01, ***P < 0.001 (vs. control group). #P < 0.05, ##P < 0.01, ##P < 0.001 (vs. LPS group).

