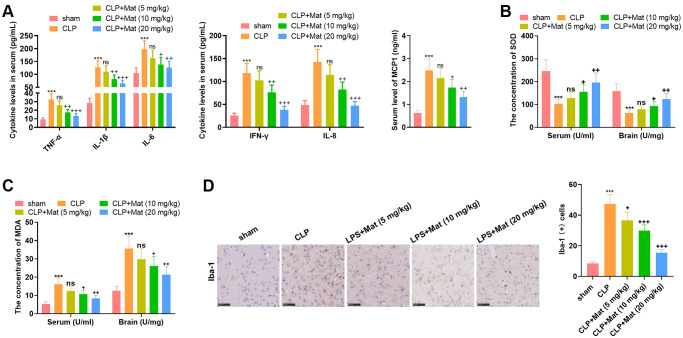
Figure 4.
Mat repressed CLP-mediated inflammation and oxidative stress. Experimental animals were treated like that in Figure 3. (A) ELISA was adopted to determine the cellular contents of TNF-α, IL-1β, IL-6, IFN-γ, IL-8 and MCP1. (B–C) The BCA protein assay kits were employed to test the concentrations of MDA and SOD in the serum and brain tissue. (D) The Iba-1 positive cell number was checked by IHC. ***P < 0.001 (vs. sham group). ns P > 0.05, +P < 0.05, ++P < 0.01, ++P < 0.001 (vs. CLP group).

