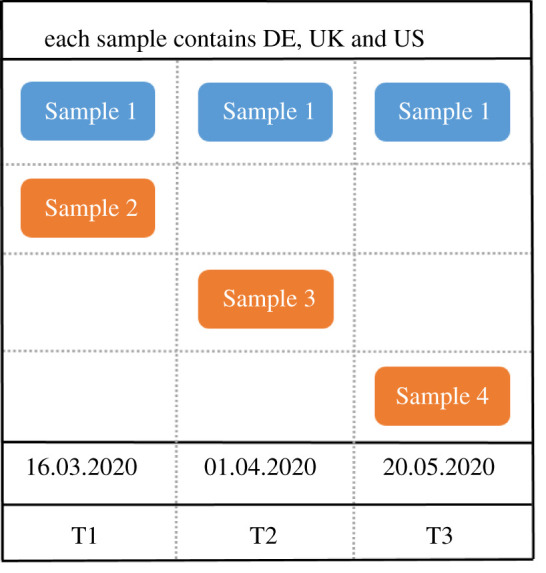
Figure 1.

A schematic of when we collected data from which samples. In the top row, the blue sample shows our within-participants design. These are the 432 participants who took part three times. The orange samples are independent, new samples that we collected at the same time as the blue samples, but each with a completely new set of participants. The bottom of the figure displays the dates at which the data was collected. The lowest row displays the names we will use to refer to the three time points in the main text. Samples 2–4 each contain new participants from Germany, the UK and the USA. Samples 1 and 2 were split post hoc based on whether participants took part in all three times points (in which case they were part of Sample 1, or not (in which case they were part of Sample 2).
