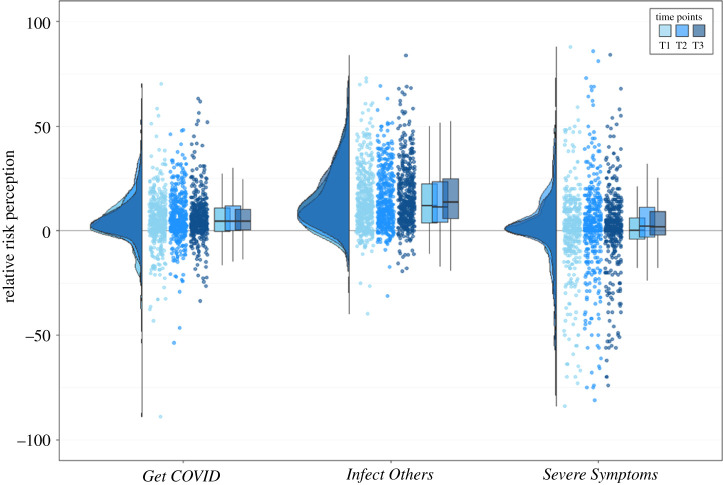
Figure 3.
Raincloud plots for relative risk perception (optimism bias; other-self), separately for the three COVID-19-related risk perception questions, separately for each time point. Each dot represents the data from one participant of Sample 1. For Get COVID, we averaged across the four different time horizons (next two weeks, next two months, next year, lifetime) and for Infect Others, we averaged across the six social contexts (family, friends, colleagues, strangers during leisure activities, strangers during vacation, strangers during daily chores like commuting and grocery shopping); Severe Symptoms is a single-item question.

