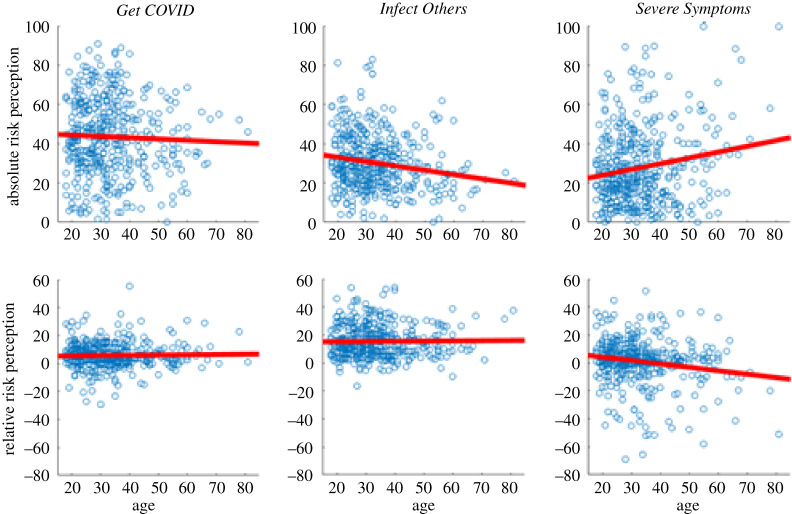
Figure 4.
Scatter plots for age, and absolute and relative risk perception for the three COVID-19-related risk perception questions. The red line displays the least squares line. For Get COVID and Infect Others, we averaged across each sub-item (severe symptoms was a single-item question). For each question, we averaged across the three time points (T1–3). Infect Others absolute risk and Severe Symptoms both absolute and relative risk are statistically significant; all others are not.

