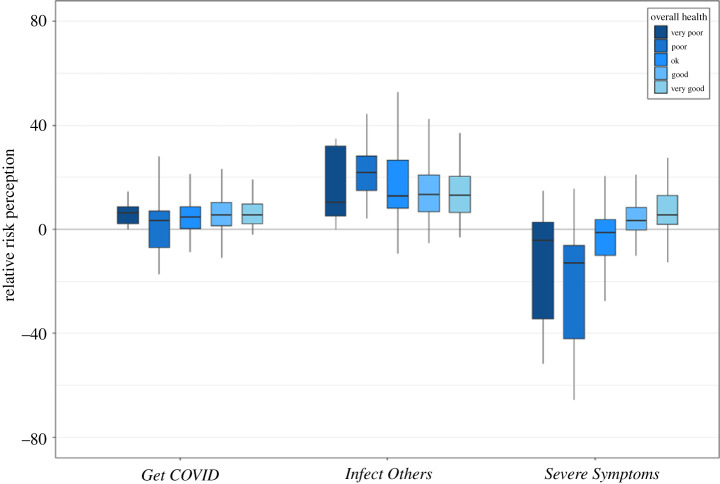
Figure 8.
Relative risk perception for the three COVID-19-related risk questions, separately for the five response options for overall health from very poor (darkest blue) to very good (lightest blue). Note that only seven people selected very poor and were excluded from the main analysis; but we represent them here for completeness. For Get COVID and Infect Others, we averaged across each sub-item (Severe Symptoms was a single-item question). For each question, we averaged across the three time points (T1–3). Box plots display the minimum and maximum (end of the lines), the first and third quartile (end of boxes), and the median (horizontal line within the box).

