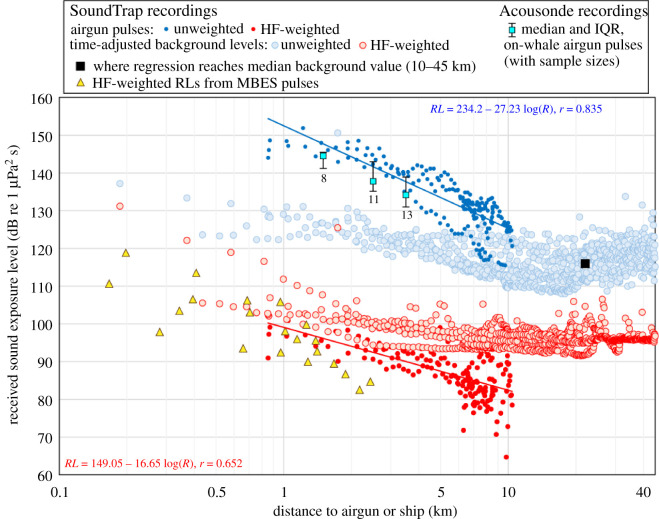
Figure 1.
Received SELs of sound from airgun and MBES pulses as compared to background levels, as a function of distance from the sound source. Logarithmic regression fits and their equations are shown for the ST airgun pulse analyses (RL is the received level, R is range in m and r is the correlation coefficient). To enable placing background levels on the same plot as pulse SELs, the 1 s background sample values were adjusted to the mean duration of the airgun pulses (1.34 ± s.d. 0.56 s). This added 10 LOG (1.34) = 1.3 dB to what would have been a 1 s SPL (or SEL) value. See electronic supplementary material for details on analyses [22].

