Figure 3.

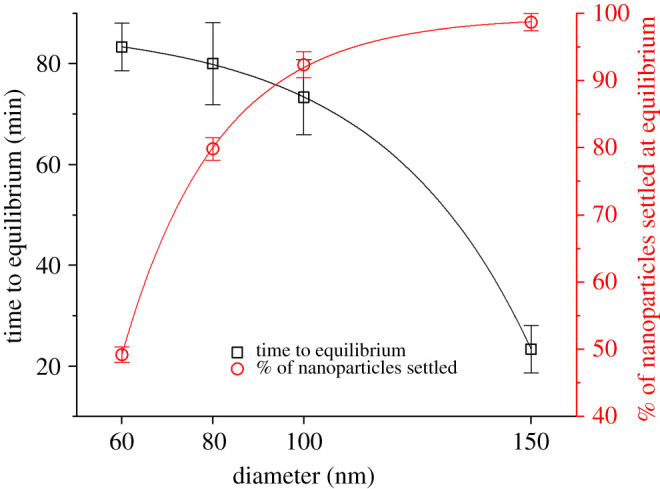
Experimental settling time (black squares and left axis) and percentage of nanoparticles settled at the equilibrium (red circles and right axis) as a function of nanoparticle diameter.

Experimental settling time (black squares and left axis) and percentage of nanoparticles settled at the equilibrium (red circles and right axis) as a function of nanoparticle diameter.