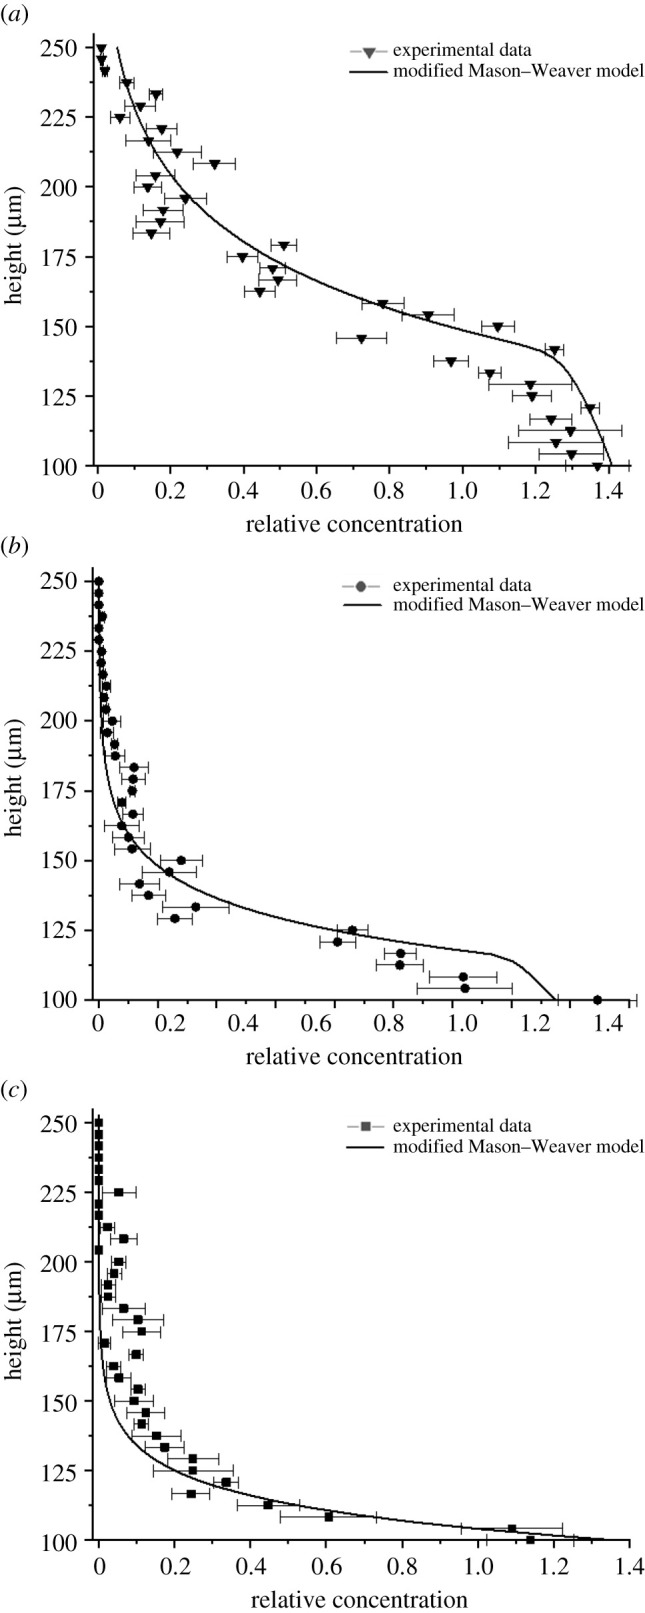
Figure 5.

Measured concentration (symbols) of (a) 60 nm; (b) 80 nm; (c) 100 nm negatively charged gold nanoparticles as a function of the height of the solution in water at 23°C after 240 min together with predictions (lines) from the proposed modified Mason–Weaver model. The concentration at each position represents the relation between the final concentration and the initial concentration (time = 0 min) measured at each specific height position. Data for 150 nm nanoparticles are not provided because both the experimental measurements and the theoretical model predictions are equal to 0 in the upper section of the solution at the equilibrium. The full concentration profile is not provided because, as the concentration of the nanoparticles forming a sediment increases, the caustics overlap, making measurements in that section less precise and unreliable.
