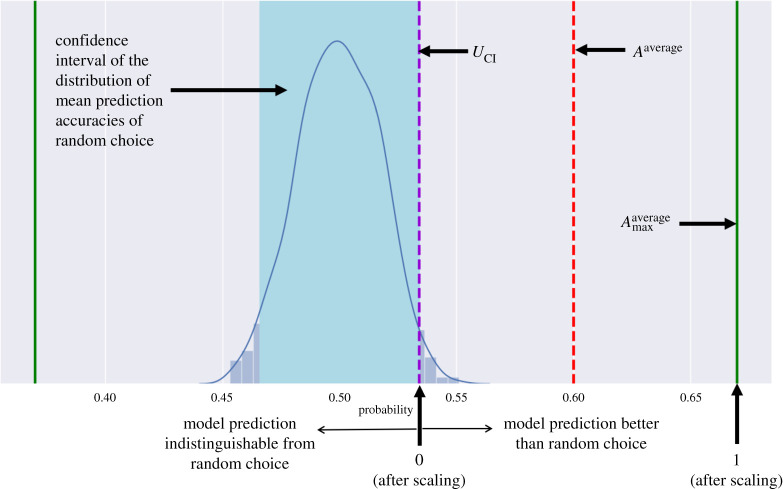
Figure 3.
Comparison of the prediction accuracy of our model to random choice under the null hypothesis of random displacement. The blue shaded area is the confidence interval of the distribution of 1000 mean prediction accuracies of random choice. The violet dashed line denotes the upper limit (UCI) of this confidence interval (equation (2.16)). The red dashed line denotes average prediction accuracy (Aaverage) (equation (2.13)) and the green solid line denotes the average maximum prediction accuracy () (equation (2.15)) (refer to section 2.3: Comparison with longitudinal dataset for details).

