
Figure 2.
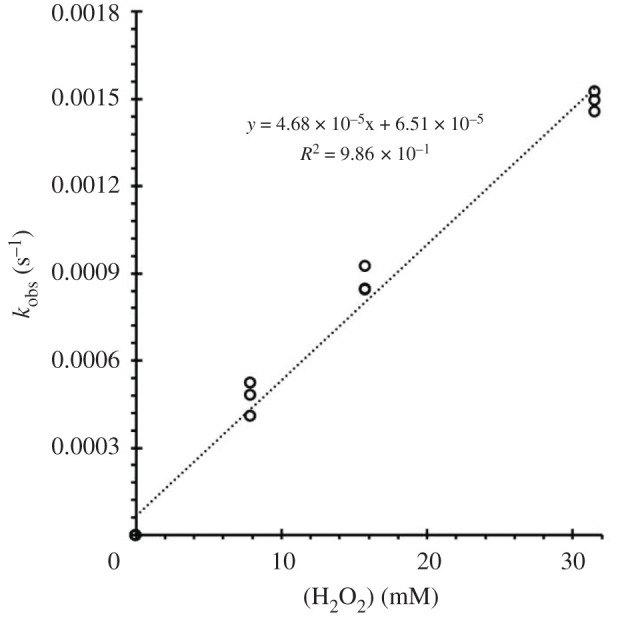
Plot of kobs (s−1) versus [H2O2]tot in aerobic phosphate buffer (118 mM) at pH 7.4 and 36.8°C. kobs values (kobs = RI/[A]i) were derived using the initial rate method by following the disappearance of the MLCT absorbance at 408 nm. Various initial concentrations [A]i were between 34 and 147 µM. Each point represents an independent experiment. The slope of this plot is 4.7 × 10⁻² M−1 s−1.