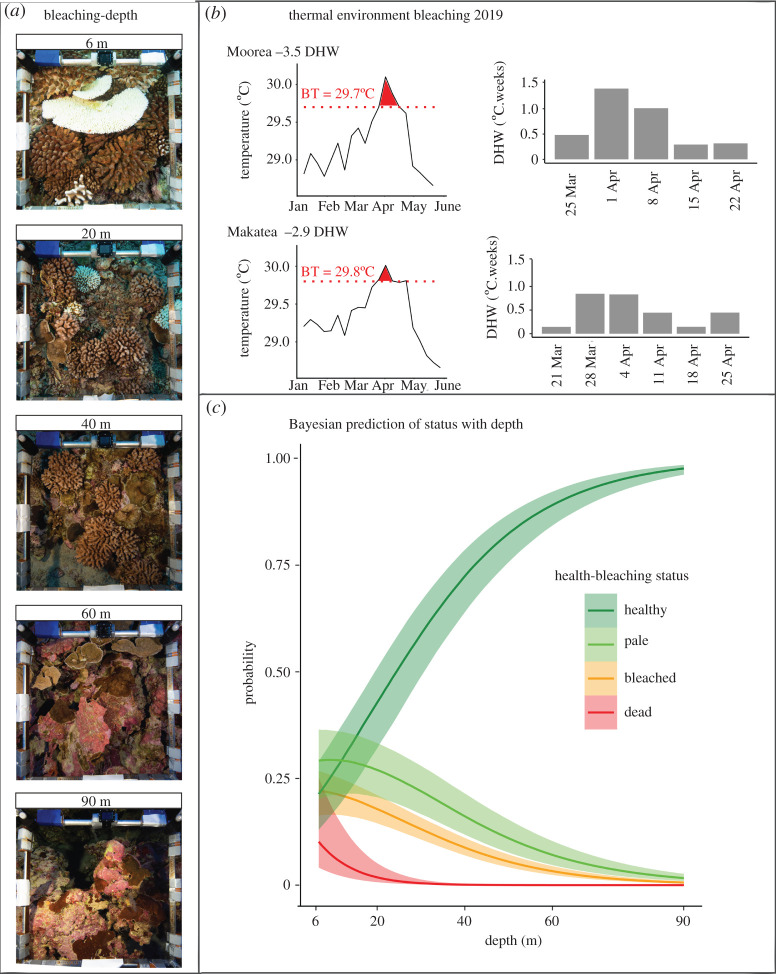
Figure 1.
(a) Sample photo-quadrats at different depths. (b) Thermal environment with degree heating weeks (DHW) values using Satellite Coral Reef Watch Temperature. (Left) Sea surface temperatures during the bleaching episode. Red fill colour shows the exposure period above the bleaching threshold marked with a dotted line. (Right) Weekly development of the DHW. (c) Bayesian prediction probability of the likelihood of corals to be healthy, pale, bleached or dead as a function of depth.

