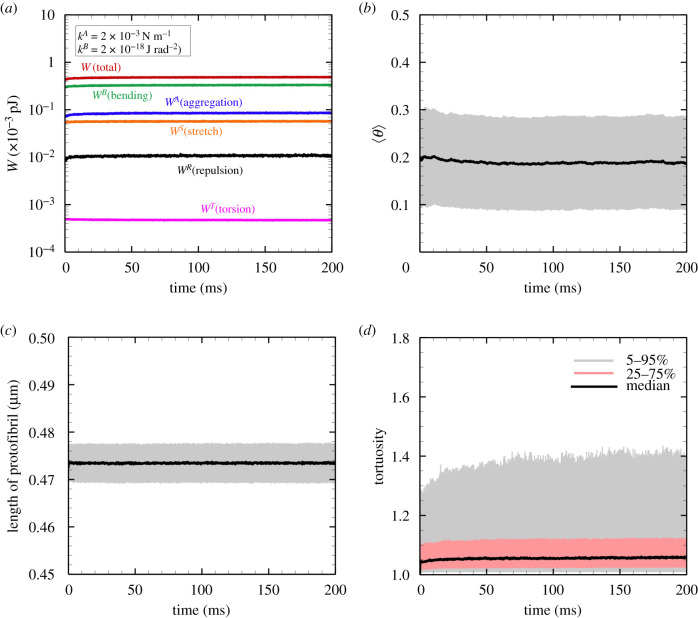
Figure 3.
(a) One of the examples of the time history of each energy type; total energy W = WB + WA + WS + WR + WT (red), bending energy WB (green), aggregation energy WA (blue), stretch energy WS (orange), repulsive energy WR (black) and torsion energy WT (pink). The time histories of the mean (b) protofibril orientation angle and (c) protofibril length, where the errors represent the standard deviation of individual protofibrils (=1215). (d) The time history of the median of the tortuosity, where the errors represent 5–95% percentile (light grey) and 25–75% percentile (red), respectively. The results were obtained with kB = 1 × 10⁻¹⁸ J rad−2 and kA = 2 × 10⁻³ N m−1.

