. 2021 Sep 29;7(5):687–700.

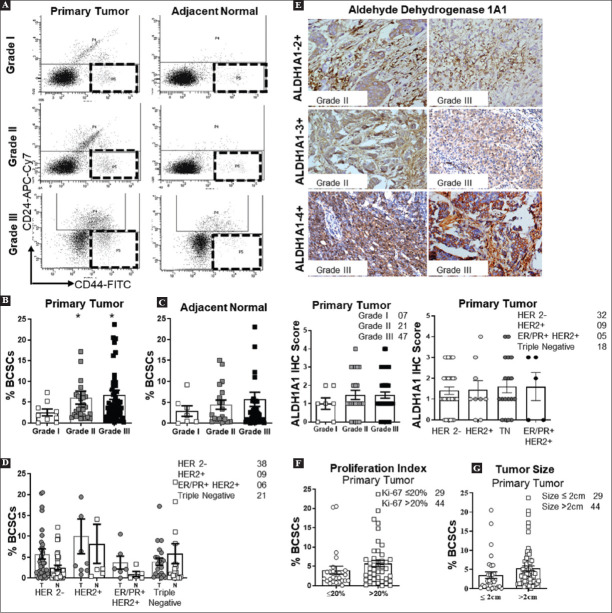
Figure 1. Frequency of BCSCs in tumor and adjacent normal breast tissues of primary breast carcinoma in clinically and pathologically defined aggressive disease setting (A). Flow cytograms representing comparative percentages of BCSCs in various histological grades in tumor (Grade I n = 9; Grade II n = 28; Grade III n = 56) and adjacent normal tissues (Grade I n = 7; Grade II n = 19; Grade III n = 49). Quantification of percentage of BCSCs by flow cytometry (Lin- CD44+ CD24-) in various histopathological grades (B). Primary Tumors (Grade II [p = 0.0369], Grade III [p = 0.032] vs. Grade I) (C) Adjacent Normal tissues. (D) Quantification of percentage of BCSCs in various molecular categories in tumor and adjacent normal tissue (ER/PR+ HER2- n = 38; ER/PR- HER2+ n = 9; ER/PR+ HER2+ n = 6; ER/PR- HER2– n = 21). (E) Representative immunohistochemical staining (40 ×) and quantification of ALDH1A1 in tumor sections in different histological grades. Comparison of IHC scores of ALDH1A1 in various histological grades (bottom panel-left) (Grade I n = 7; Grade II n = 21; Grade III n = 47) and molecular categories (ER/PR+ HER2- n = 32; ER/PR- HER2+ n = 9; ER/PR- HER2- n = 18; ER/PR+ HER2 + n = 5). (bottom panel-right) (F) Differences in percentage of BCSCs in tumors sized ≤2 cm and >2 cm (G) Differences in percentage of BCSCs in Ki-67 ≤20% and >20% tumors. Bars represent Mean, and error bars represent ± SEM. Unless mentioned, statistical comparisons between groups were performed using Kruskal–Wallis and Dunn’s multiple comparisons tests. *p < 0.05, **p < 0.01, ***p < 0.001.

Figure 1