. 2021 Sep 29;7(5):687–700.

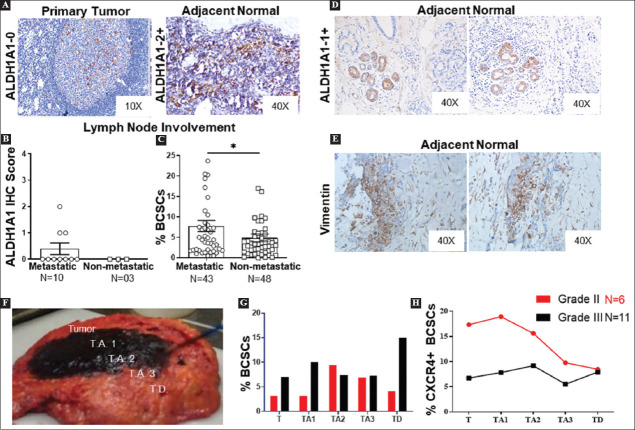
Figure 2. Invasive behavior of BCSCs and their involvement in breast cancer metastasis (A). Representative immunohistochemical stained micrographs of ALDH1A1 staining in metastatic/non-metastatic lymph nodes. (B) Bar graph representing the percentage of BCSCs in Metastatic LN tumors (n = 43) and non-metastatic LN tumors (n = 48) by flow cytometry (C) ALDH1A1 staining on lymph node sections in metastatic (n = 10)/non-metastatic (n = 3) lymph node category (D) Presence of ALDH1A1+ cells within well-arranged histologically normal mammary ducts in tumor vicinity (n = 3) (E) Immunohistochemical staining for vimentin (n = 3) on adjacent normal sections near tumor vicinity (F) Representative mastectomy specimen serially dissected by histologist to obtain following tissues: primary tumor (T), T.A. 1 (Tumor Adjacent 1; 3 mm from T); T.A. 2 (Tumor Adjacent 2; 1 cm from T); T.A. 3 (Tumor Adjacent 3; 2 cm from T); T.D. (Tumor Distant; 4 cm from T) (G) Quantification of the percentage of BCSCs at the primary tumor site and different tissue intervals in grade II (n = 6) and grade III (n = 11). (H) Line plot representing the distribution of CXCR4 expressing BCSCs at different tissue levels (Grade II n = 6; Grade III n = 11). For all data, bars indicate means, and error bars indicate ±SEMs. **p < 0.01, ****p < 0.0001.

Figure 2