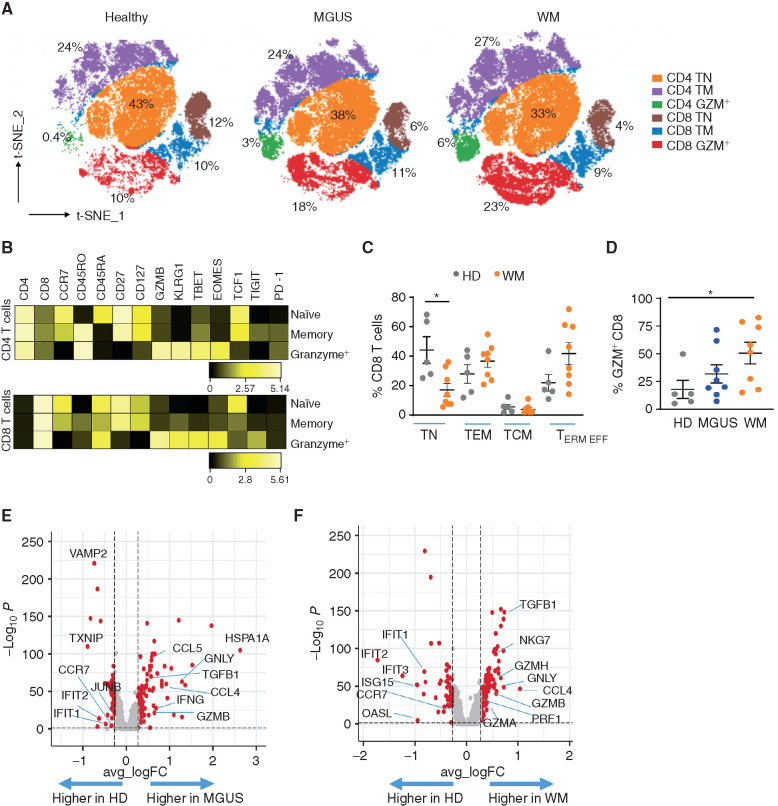
Figure 5.
Changes in T cells. A, T-distributed Stochastic Neighbor Embedding (t-SNE) plot of changes in T cells by cohort. Bone marrow mononuclear cells from HDs, MGUS, and WM were analyzed using mass cytometry. CD3 T cells from HDs, MGUS, and WM cohorts were concatenated using equal numbers of cells from individual patients and analyzed using t-SNE analysis. Overlay plot shows distribution of T cells across different cohorts with progressive increase in CD8 granzyme+ T cells (red) in MGUS/WM and decline in naïve CD8+ T cells (brown) compared with HDs. TM, memory T cell; TN, naïve T cell. B, Phenotype of major CD4/CD8+ T-cell subsets. Heat map shows protein expression of cell-surface markers as well as transcription factors/lytic molecules in the different T-cell subsets shown in A. The CD8+ granzyme+ T cells enriched in WM have a phenotype of TCF1loTigit+ KLRG1+ T cells. C, Proportions of CD8 T-cell subsets in HDs and WM. Supplementary figure shows naïve (TN; CCR7, CD45RO−), effector memory (TEM; CCR7−CD45RO+), central memory (TCM; CCR7−, CD45RO+CD45RA+), and terminal effector (TERM EFF; CCR7−CD45RO−) cells as a percentage of total CD8 T cells in HDs and WM patients. Each dot represents a unique patient. *, P < 0.05, Kruskal–Wallis. D, Proportion of granzyme-positive CD8 T cells as a proportion of total CD8 T cells in HDs as well as MGUS and WM patients. Each dot represents a unique patient. *, P < 0.05, Kruskal–Wallis. E, Volcano plot of differentially expressed genes in CD8+ T cells in MGUS versus HDs based on CITE-seq. F, Volcano plot of differentially expressed genes in CD8+ T cells WM versus HD based on CITE-seq.

