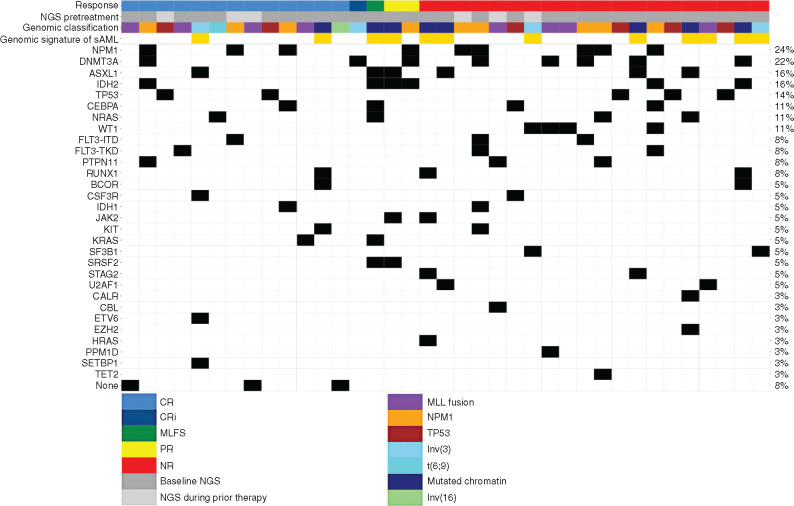
Figure 3.
Genomic signatures and response matrix. Gene matrix representing mutations identified by next-generation sequencing (NGS) prior to treatment. Each individual patient is listed as a column on the x-axis. Mutations identified as present prior to treatment are colored in black. Thirty-one patients had NGS performed as baseline prior to treatment on study (dark gray), whereas six patients (light gray) had NGS performed during prior lines of therapy. Genomic classification was determined based on Papaemmanuil et al. (19). Genomic signature of secondary AML (sAML) was determined based on Lindsley et al. (ref. 20; beige color denotes patients with secondary AML based on genomic signature). Mutations are listed in order of prevalence on the y-axis. The percentage listed in the last column represents prevalence of the gene mutation in the overall cohort.

