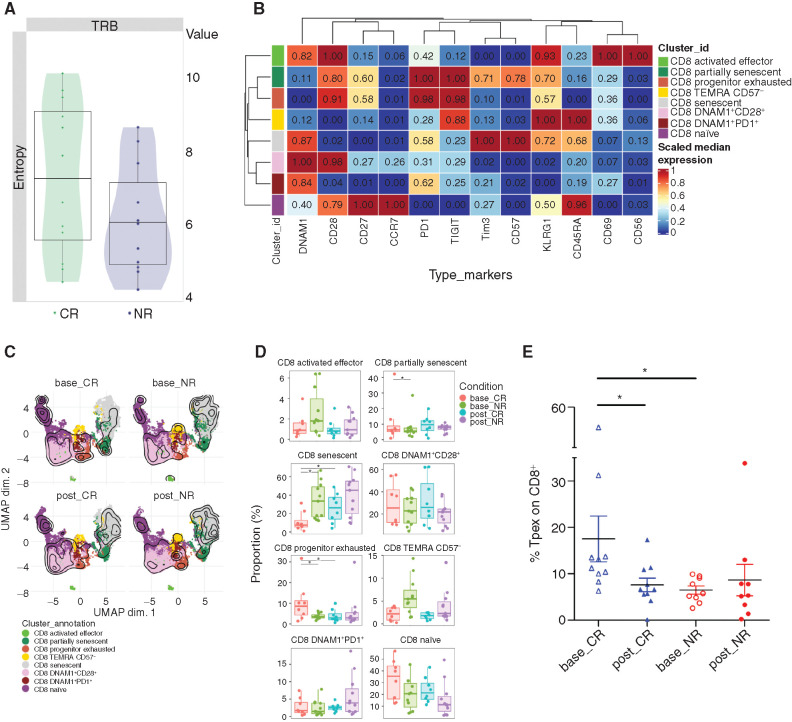
Figure 4.
Immune biomarkers associated with response. A, Shannon entropy of CR (n = 12) and NR (n = 11) pretreatment PB TCR samples. Uncorrected P = 0.15 comparing CR versus NR patients. TRB, TCR Vβ. B, Heatmap showing the 0 to 1 scaled mean fluorescence intensity values of 12 markers over the eight CD8+ BM subsets from all samples (NR: n = 11; CR: n = 8). The median marker expression identifies the markers that characterize each cell subset. Each CD8+ subpopulation is colored according to the cluster identified using the FlowSOM algorithm:
CD8 activated effector: DNAM1+CD28+KLRG1+CD69+CD56+; CD8 partially senescent: CD28+CD27+KRLG1+CD57+; CD8 progenitor exhausted: CD28+PD1+TIGIT+; CD8 TEMRA CD57−: CD45RA+KLRG1+CD57−; CD8 senescent: CD45RA+KLRG1+CD57+; CD8 DNAM1+CD28+: DNAM1+CD28+; CD8 DNAM1+PD1+: DNAM1+PD1+; and CD8 naïve: CCR7+CD45RA+CD27+CD28+. C, UMAP visualization overlaid with contour plots (kernel density estimation) of the eight CD8+ BM subpopulations in nonresponders (NR, n = 11) and those achieving complete remission (CR, n = 8), at baseline (base_CR, base_NR) or after therapy (post_CR, post_NR). Each CD8+ subpopulation is colored according to the cluster identified using the FlowSOM algorithm. D, Boxplots showing the relative abundance of BM CD8+ subpopulations in NR and CR patients at baseline and posttreatment. Horizontal bars indicate median values. Asterisks indicate adjusted P values (*, Padj < 0.05). E, Frequency of BM CD8+CD45RA−CD27+/intCD28+PD1+TCF1+ T cells in patients who achieved CR compared with NRs at baseline and at response assessment (*, P < 0.05). Tpex, precursor exhausted.

