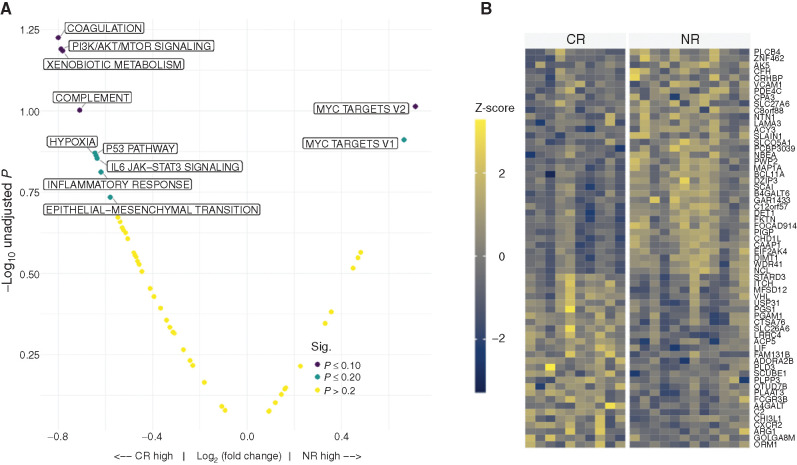
Figure 5.
A, GSEA of pretreatment BM blast samples using the hallmark gene sets from the MSigDB (http://www.gsea-msigdb.org/gsea/msigdb/collections.jsp; ref. 53). B, Heatmap displaying the differential expression of genes from pretreatment BM blast RNA samples comparing CR versus NR patients. FDR P ≤ 0.20 shown.

