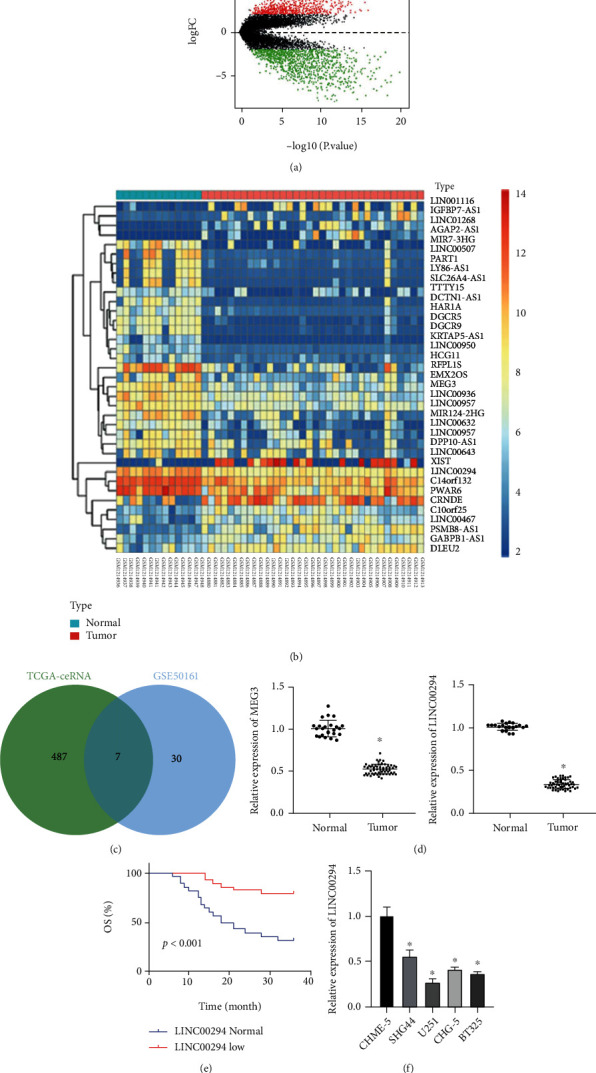
Figure 1.

LINC00294 was poorly expressed in glioma and significantly correlated with clinical prognosis. (a) Volcano plot of differentially expressed genes in microarray dataset GSE50161: the abscissa represented −log10p value and the ordinate represented logFC; the red dots indicated the highly expressed genes in tumor and the green dots indicated the poorly expressed genes in tumor. (b) Heat map of differentially expressed lncRNAs in microarray dataset GSE50161: the abscissa represented the sample number and the ordinate represented the lncRNA name; the left dendrogram showed the clustering of lncRNA expression pattern; each square showed the expression of lncRNA in a sample; the upper right histogram was the color scale. (c) Intersection of the lncRNAs of ceRNA mechanism in TCGA and the differentially expressed lncRNAs in GSE50161, and the middle part represented the intersection of the two sets of data. (d) Expression patterns of MEG3 and LINC00294 in glioma patients were detected using RT-qPCR (normal N = 24; tumor N = 57). (e) Correlation between LINC00294 expression pattern and clinical survival rate was analyzed. (f) Expression pattern of LINC00294 in microglia and glioma cells was detected using RT-qPCR. The cell experiment was conducted three times independently. Data were expressed as mean ± standard deviation and analyzed using the t-test; ∗p < 0.05vs. the normal group or the CHME-5 group.
