
Figure 1.
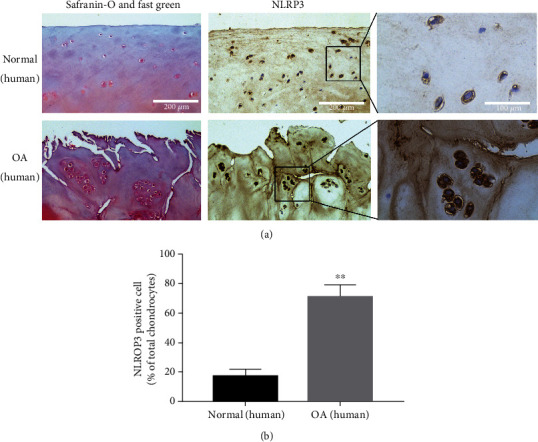
NLRP3 expression was enhanced in human OA cartilage. (a) Safranin-O and fast green and immunohistochemical staining of human knee articular cartilage. Scale bar: 200 μm and 100 μm. (b) Quantification analysis of NLRP3 expression in human cartilage. Data are shown as the mean ± SD. Significant differences between groups are indicated as ∗P < 0.05, ∗∗P < 0.01, and ∗∗∗P < 0.001 vs. normal group.