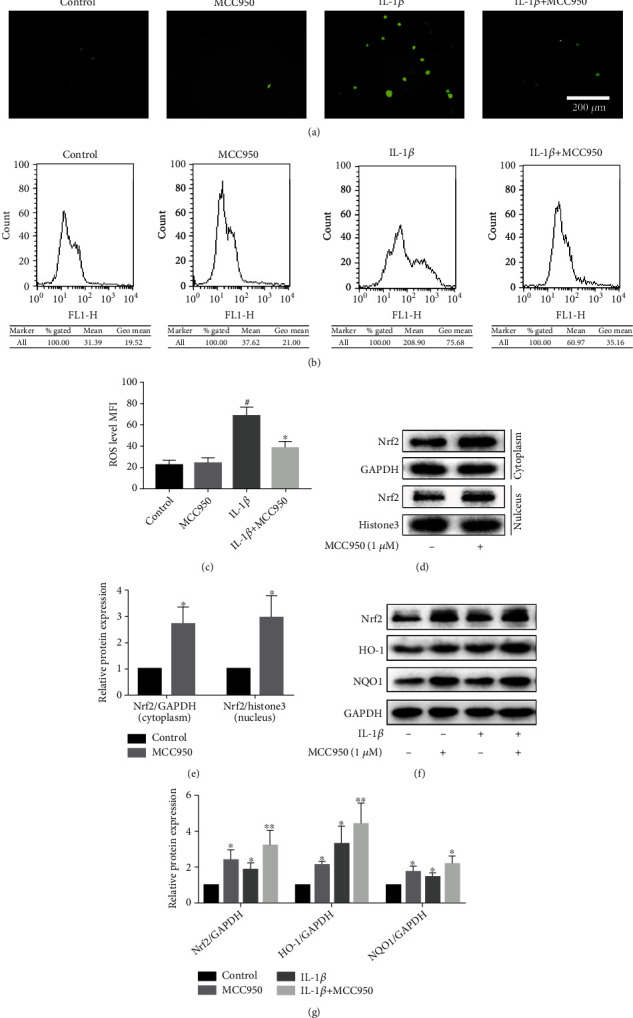
Figure 5.

Antioxidative effect of MCC950. Mouse chondrocytes were pretreated with MCC950 for 2 h, then stimulated with 5 ng/ml IL-1β for 24 h. (a) ROS production observed under a fluorescence microscope. Scale bar: 200 μm. (b) Flow cytometry results of ROS production. (c) Quantification analysis of the mean fluorescence intensity (MFI) of ROS in chondrocytes. #P < 0.05 vs. control group; ∗P < 0.05 vs. IL-1β group. (d, e) Western blotting results and quantification analysis of Nrf2 nuclear/plasma protein expression. ∗P < 0.05 vs. control group. (f, g) Western blotting results and quantification analysis of Nrf2/HO-1/NQO1 pathway proteins. ∗P < 0.05 and ∗∗P < 0.01 vs. control group.
