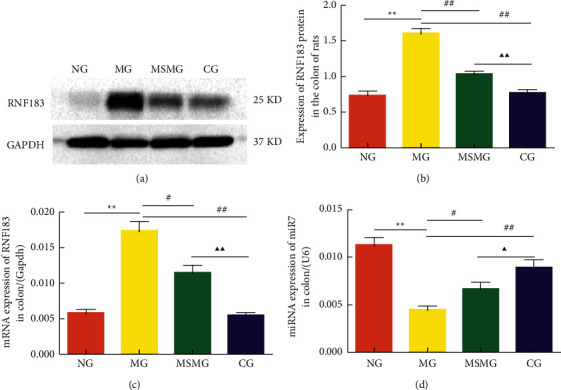
Figure 5.

Comparison of the expression of colonic RNF183 protein and mRNA and miR7: (a) representative Western blot result showing the expression of RNF183 protein in each group; (b) quantification showing the expression of RNF183 protein in each group; (c) quantification showing the expression of RNF183 mRNA in each group; and (d) quantification showing the expression of miR7 in each group. NG: normal group; MG: model group; MSMG: moxa-stick moxibustion group; CG: control group. Data expressed as mean ± SEM, n = 10 per group; vs. NG, ∗P < 0.05 and ∗∗P < 0.01; and vs. MG, #P < 0.05 and ##P < 0.01; and vs. MSMG, ΔP < 0.05 and ΔΔP < 0.01.
