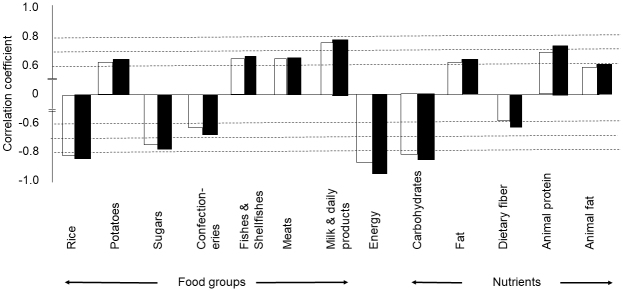
Figure 3.
Correlation coefficient between increase in new cases of inflammatory bowel disease and food groups, nutrients, or energy.
Data from 1965 to 2000 were used. Foods, nutrients, or energy with a p value less than 0.0001 are shown in this figure, except for dietary fiber for ulcerative colitis (p < 0.001) (Table 2). The white column shows ulcerative colitis, and the black column shows Crohn’s disease.

