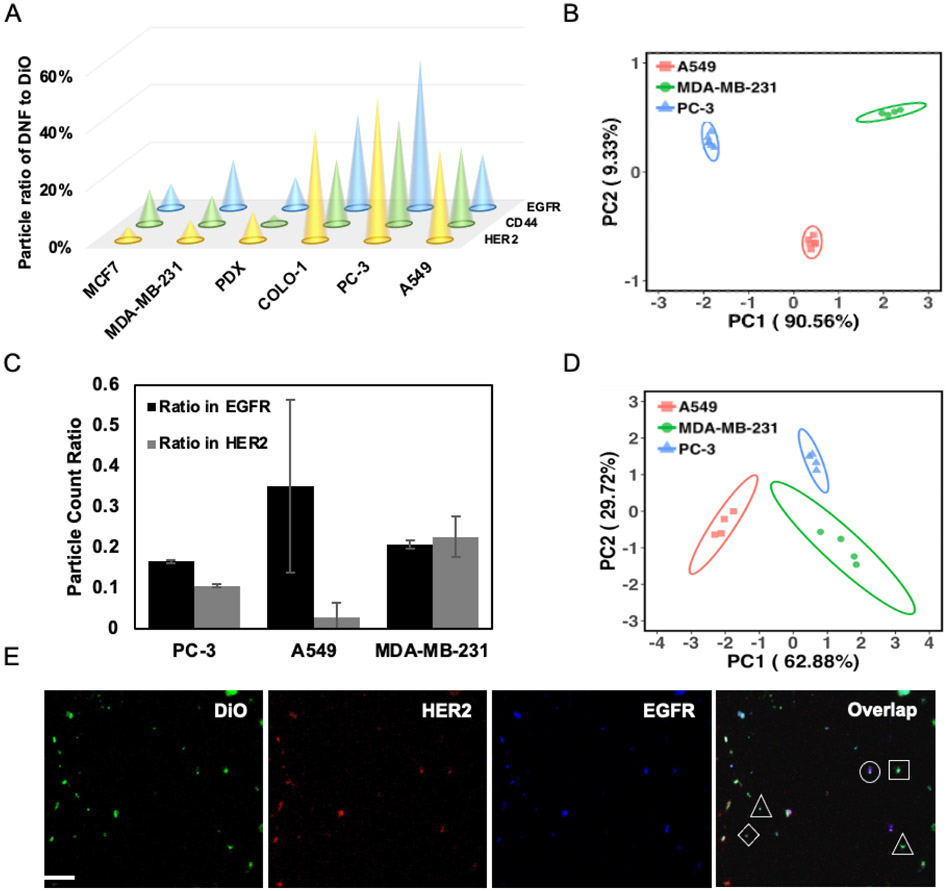
Figure 3.
(A) Comparison of the expression profiles, represented by the average particle ratios (n = 6), of 3 protein markers in the EVs derived from six cell lines. Average relative standard deviation of all measurements < 5%. (B) PCA scores plot to differentiate EVs derived from three cell lines based on the protein profiles shown in (A); ellipses indicate 95% confidence. (C) Ratio of EV carrying both markers detected in the EV population captured by anti-EGFR and anti-HER2 Ab, respectively, using the dual-marker colocalization assay. (D) PCA scores plot to differentiate EVs derived from three cell lines based on the protein profiles shown in (B); ellipses indicate 95% confidence. (E) Representative 3-color CFM images for the DiO-stained EV with dual-DNF labeling. Triangle – EV labeled with DiO; Square – EV labeled with both DiO and EGFR-specific DNFs; diamond – EV labeled with both DiO and HER2-specific DNFs; Circles – EV labeled with DiO, HER2-specific DNFs and EGFR-specific DNFs.

