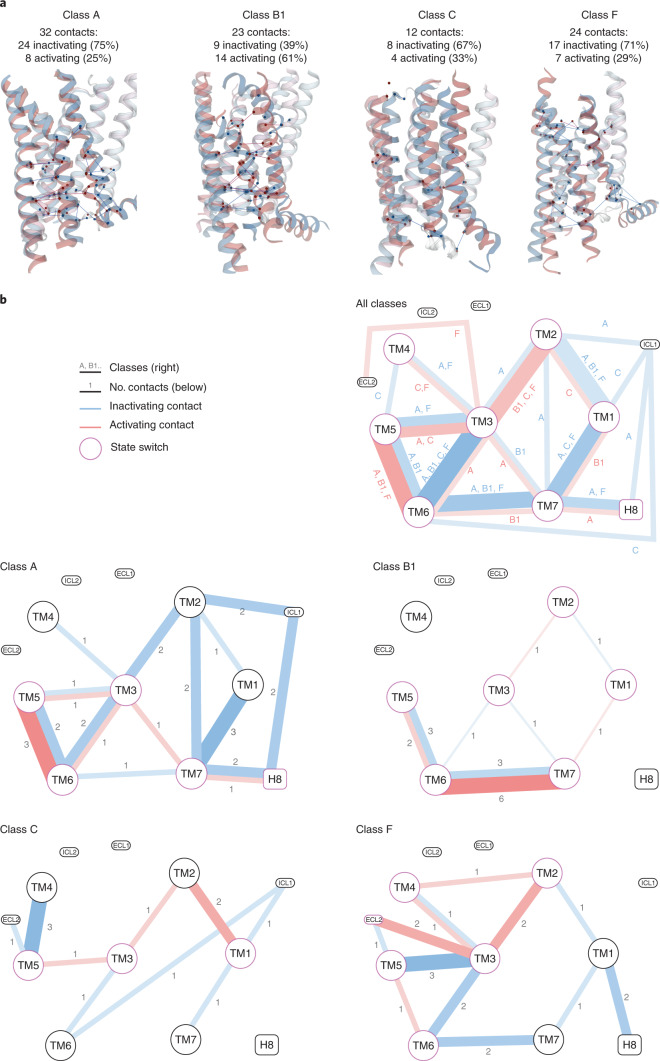
Fig. 3. GPCRs stabilize inactive and active states by rerouting contacts between TM1–7, H8, ICL1 and ECL2.
a, State-specific residue-residue contacts in each GPCR class visualized as lines within representative inactive/active receptor structure pairs (same as in Fig. 2b,c). Numbers indicate the total, inactivating and activating contacts in each GPCR class. b, Contact networks between the seven GPCR transmembrane helices, TM1–7, and the first intracellular (ICL1) and second extracellular (ECL2) loops (intrasegment contacts not shown). Line thickness represents the number of classes (top-most) or contact frequency differences between the inactive and active states. Line color indicates inactivating (blue) and activating (red) contacts. Receptor segments with a magenta border are ‘switches’, that is, having contacts across both states. Contacts are identified on the basis of a higher frequency (%) in inactive than in active-state receptors. a,b, The frequency difference threshold was set according to the structural coverage in each GPCR class (threshold: no. members, inactive/active state templates): A: 40% (285, 33/14), B1: 67% (15, 3/10), C: 75% (22, 4/2) and F: 100% (11, 2/2). To ensure that the identified determinants are applicable throughout each class, we also applied a sequence conservation cut-off requiring at least 30% of all its receptors to contain one of the amino acid pairs observed to form the given state-specific contact. Contact definitions are explained in the settings menu of the online ‘Comparative structure analysis’ tool (https://review.gpcrdb.org/structure_comparison/comparative_analysis).

