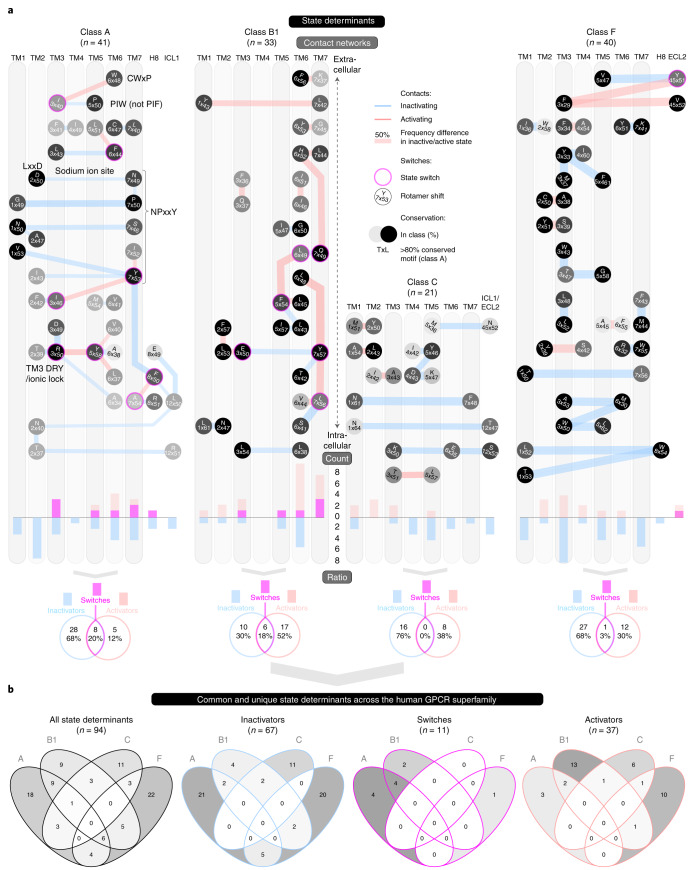
Fig. 4. State-stabilizing contact maps and differences at the residue-level ‘microswitches’.
a, Contact networks visualize the wiring of state determinants from the extracellular (top) to intracellular (bottom) sides. Contact frequency differences between the inactive and active states are shown as varied line thickness, and residue rotamers as rotation of the consensus amino acid in the analyzed structure and its generic residue number. Two-way Venn diagrams depict the number and percentages of inactivator (blue), activator (red) and switch (magenta) state-determinant positions. Bar diagrams show their distribution across the TM helices, H8 and loops. b, Comparison of common and unique state-determinant positions across all investigated classes.

