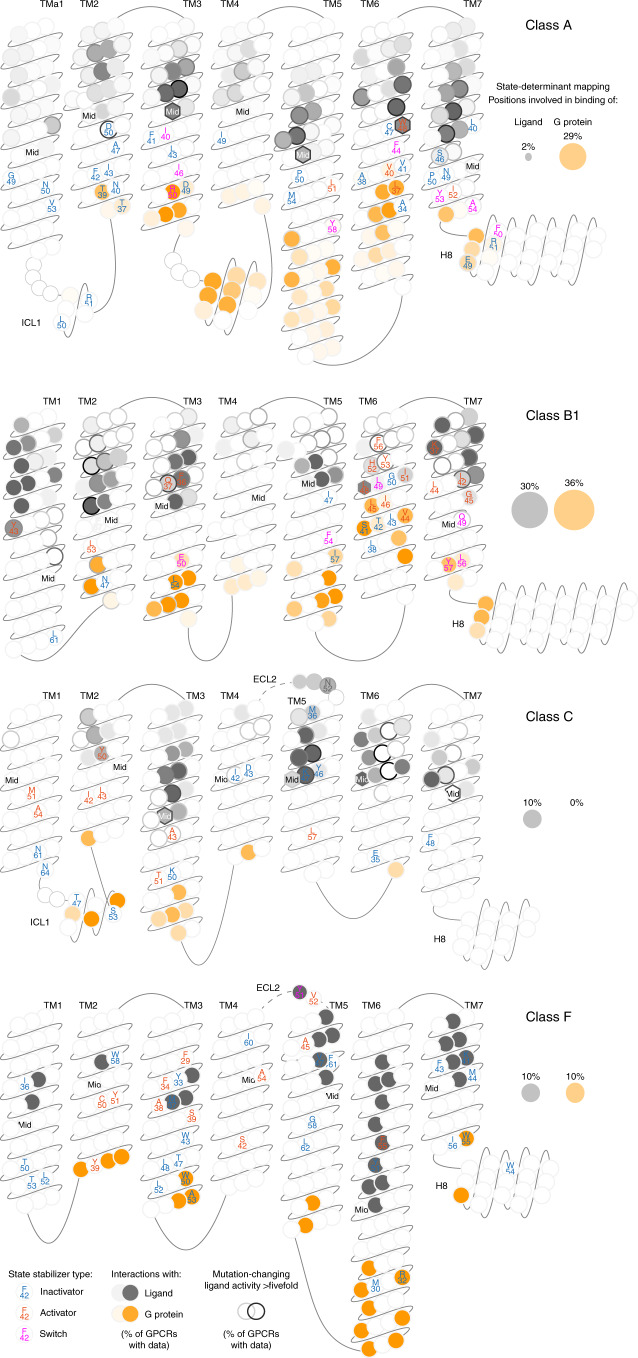
Fig. 6. Residue positions stabilizing an inactive and/or active receptor state.
GPCR snakeplots mapping the residue positions that form distinct contacts between state determinants classified as inactivators (blue), activators (red) and switches (magenta). Residues are denoted with the consensus amino acid of the investigated receptor structures (Supplementary Table 1) and their generic residue number26. Filled positions map ligand- (gray) and G-protein (orange) interaction frequency among all GPCR structures in the given class that have such data (Supplementary Data 2). Allosteric ligand-interacting positions outside of the upper part of the transmembrane helix domain and ECL2 (the orthosteric binding pocket in classes A, B1 and F) are omitted. Border grayscale denotes the frequency of mutations changing the ligand affinity or activity over fivefold. The label ‘Mid’ within hexagon-shaped positions denotes the membrane mid, above and below which the ligand positions are subdivided into ‘upper 7Tm and ECL2’ or ‘other’).

