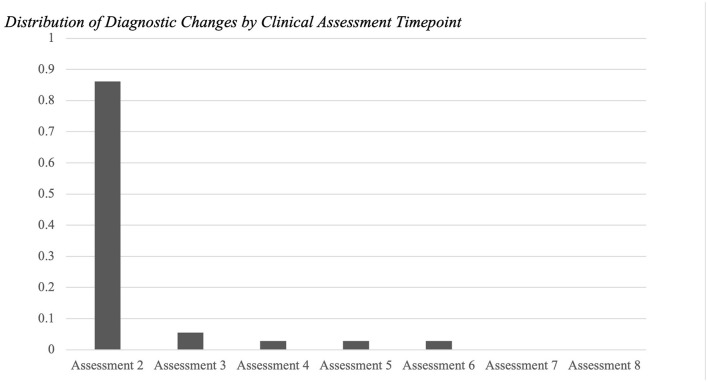
Figure 2.
Distribution of diagnostic changes by clinical assessment timepoint. Out of the 36 diagnostic changes that were recorded, 86% occurred at the time of the second clinical assessment (N = 142). 6% of the changes occurred at the third time point (N = 27). Followed by fourth (N = 15), fifth (N = 7), and sixth (N = 3) (all 3%). No diagnostic changes occurred at the seventh or eighth timepoints for any participant (N = 2 and N = l, respectively).

